Transcription of More Than Half Children Not Learning - UNESCO UIS
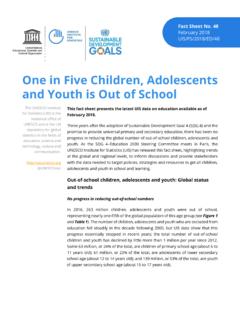
1 Fact Sheet No. 46 September 2017 UIS/FS/2017/ED/46 More Than One-Half of Children and Adolescents Are Not Learning Worldwide This paper presents the first estimates for a key target of Sustainable Development Goal 4, which requires primary and secondary education that lead to relevant and effective Learning outcomes. By developing a new methodology and database, the UIS has produced a global snapshot of the Learning situation facing Children and adolescents who are in school and out. The data show the critical need to improve the quality of education while expanding access to ensure that no one is left behind. The paper also discusses the importance of benchmarking and the concept of minimum proficiency levels. More than 617 million Children and adolescents are not achieving minimum proficiency levels (MPLs) in reading and mathematics, according to new estimates from the UNESCO Institute for Statistics (UIS). This is the equivalent of three times the population of Brazil being unable to read or undertake basic mathematics with proficiency.
2 The new data signal a tremendous waste of human potential that could threaten progress towards the Sustainable Development Goals (SDGs). Many of the global goals depend on the achievement of SDG 4, which demands an inclusive and equitable quality education and the promotion of lifelong Learning opportunities for all . In particular, Target demands that all Children complete primary and secondary education of sufficient quality to ensure that they have relevant and effective Learning outcomes . To measure progress globally, the international community has agreed to use following indicator: Proportion of Children and young people: (a) in Grades 2 or 3; (b) at the end of primary education; and (c) at the end of lower secondary education achieving at least a minimum proficiency level in (i) reading and (ii) mathematics. The UNESCO Institute for Statistics (UIS) is the official source of internationally-comparable data on education and literacy used to monitor progress towards the Sustainable Development Goals.
3 @ UNESCO stat 2 UIS Fact Sheet No. 46 | September 2017 This paper presents the first estimates for this global indicator and discusses the impact of benchmarks. As the official source of SDG 4 data, the UIS has developed a methodology that captures data not only on Children and adolescents who are in school but also the out-of-school populations who have little or no opportunity to achieve minimum levels of proficiency. Six out of ten Children and adolescents are not Learning globally Globally, six out of ten Children and adolescents are not achieving minimum proficiency levels in reading and mathematics (see Figure 1 for reading and Annex Table A1 for mathematics). The total 617 million includes more than 387 million Children of primary school age (about 6 to 11 years old) and 230 million adolescents of lower secondary school age (about 12 to 14 years old). This means that more than one-half 56% of all Children won t be able to read or handle mathematics with proficiency by the time they are of age to complete primary education.
4 The proportion is even higher for adolescents, with 61% unable to achieve minimum proficiency levels when they should be completing lower secondary school. Figure 1. Global number of Children and adolescents who do not achieve MPLs in reading, by age group, SDG region and sex Source: UNESCO Institute for Statistics 3 UIS Fact Sheet No. 46 | September 2017 Table 1. Numbers of Children and adolescents not reaching MPLs in reading, by SDG region, 2015 Notes: GPIA = adjusted gender parity index (female/male rate of Children not Learning , see Box 1). Source: UNESCO Institute for Statistics Region Reading Proportion of school age population not achieving minimum proficiency levels Number of school age Children /adolescents not achieving minimum proficiency levels (in millions) Proportion of school age Children / adolescents in world population Regional share of global proportion of Children /adolescents not Learning Total Male Female GPIA Total Male Female Total (primary and lower secondary school age Children and adolescents)
5 Sub Saharan Africa 88 86 90 202 100 102 21 33 Western Asia and Northern Africa 57 58 56 46 24 22 7 7 Central and Southern Asia 81 84 77 241 132 109 28 39 Eastern and South eastern Asia 31 32 28 78 43 34 24 13 Latin America and the Caribbean 36 38 34 35 19 16 9 6 Northern America and Europe 14 17 12 15 9 6 10 3 Oceania 22 24 19 1 0 World 58 59 56 617 328 290 100 100 Primary school age Children Sub Saharan Africa 87 85 90 138 68 70 23 36 Western Asia and Northern Africa 54 54 53 28 14 14 7 7 Central and Southern Asia 81 85 77 152 83 69 27 39 Eastern and South eastern Asia 29 31 26 48 27 21 24 12 Latin America and the Caribbean 26 27 25 16 8 7 9 4 Northern America and Europe 7 8 6 5 3 2 9 1 Oceania 21 22 19 1 0 World 56 57 55 387 204 183 100 100 Lower secondary school age adolescents Sub Saharan Africa 89 89 89 63 32 31 19 28 Western Asia and Northern Africa 64 67 61 18 10 8 7 8 Central and Southern Asia 80 83 76 89 48 40 29 39 Eastern and South eastern Asia 34 36 33 30 16 14 23 13 Latin America and the Caribbean 53 58 48 19 11 9 10 8 Northern America and Europe 25 29 21 11 6 4 11 5 Oceania 24 29 18 0 0 World 61 63 59 230 124 107 100 100 4 UIS Fact Sheet No.
6 46 | September 2017 Box 1. The Adjusted Gender Parity Index (GPIA) Parity indices are the main indicator used to monitor progress towards SDG Target : eliminate gender disparities in education and ensure equal access to all levels of education and vocational training for the vulnerable, including persons with disabilities, indigenous peoples and Children in vulnerable situations . The most widely known index of this kind is the gender parity index (GPI). The GPI is calculated by dividing the female value of an indicator by the male value. If both values are the same, the GPI has a value of 1. To allow small variations in indicator values, gender parity is usually assumed to exist at values between and However, the GPI is an imperfect measure because it is not symmetrical around 1 and has no upper limit, with a theoretical range of 0 to infinity. To address these disadvantages, the UIS has developed an adjusted GPI (GPIA) that is symmetrical around 1 and limited to a range between 0 and 2.
7 The adjusted GPI is calculated as follows: If female indicator value male indicator value: Adjusted GPI = female value / male value If female indicator value > male indicator value: Adjusted GPI = 2 1 / (female value / male value) If the female value of an indicator is less than or equal to the male value, the unadjusted and adjusted GPI are identical. If the female value is greater than the male value, the adjusted GPI is systematically smaller than the unadjusted GPI. If the rate of girls not Learning is 50% and the male rate is 40%, then the adjusted GPI will be , which is the same distance from 1 as the value (calculated from a female rate of 40% and a male rate of 50%), in contrast to the unadjusted GPI value of For the rates of Children not Learning , an adjusted GPI (GPIA) greater than 1 means that girls are less likely to be Learning than boys and thus at a relative disadvantage, whereas a value below 1 means that boys are facing the disadvantage.
8 As with the unadjusted GPI, values of the adjusted GPI (GPIA) between and are interpreted to indicate gender parity. The data in Figure 2 underscore the urgent need to dramatically improve education access, retention and quality. The international community must not only make good on the longstanding promise to get all Children in school but also ensure that they stay in school and learn, while completing an education that prepares them for decent employment and a fulfilling life in the 21st Century. 5 UIS Fact Sheet No. 46 | September 2017 Figure 2. Proportion of Children and adolescents not achieving MPLs, by age group and Learning domain Source: UNESCO Institute for Statistics The next section presents more detailed information on the rates and numbers of Children and adolescents lacking minimum proficiency levels in reading for the regions used to monitor the SDGs (see Box 2). The regional view: Uneven distribution of Children unable to read proficiently The global figures on Children not Learning hide large regional differences.
9 Figures 3a and 3b present the regional distribution of the primary and lower secondary school-age population in contrast to the regional distribution of the number of Children and adolescents not achieving minimum proficiency levels in reading. It provides an initial look at the scale of the challenges facing certain regions. For example, one out of five (21%) Children and adolescents of primary and lower secondary school age lives in sub-Saharan Africa. Yet the region is home to one out of three (33%) of all Children and adolescents unable to read proficiently. A similar situation is found in Central and Southern Asia. 5755555663595958010203040506070 MaleFemaleMaleFemale(%)Reading MathematicsLower secondary school agePrimary school age6 UIS Fact Sheet No. 46 | September 2017 Source: UNESCO Institute for Statistics Box 2. Regional groupings used to monitor the SDGs This analysis applies a new set of regional groupings that are used to monitor the SDGs.
10 It is important to note that they are different from the 10 regions used to monitor the Millennium Development Goals (MDGs) between 2000 and 2015. For SDG monitoring, the world is divided into the seven regions as displayed in Figure 4. 7 UIS Fact Sheet No. 46 | September 2017 More than 85% of Children in sub-Saharan Africa are not Learning the minimum Despite years of steady growth in enrolment rates, the education situation in sub-Saharan Africa continues to threaten the future of entire generations. New UIS data show that 88% of all Children and adolescents will not be able to read proficiently by the time they are of age to complete primary and lower secondary education (see Figure 5). If current trends continue, this crisis will affect about 202 million Children and adolescents, including 138 million of primary school age and 63 million of lower secondary school age. Across the region, girls of primary school age face the greatest disadvantage.