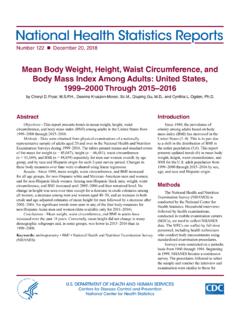
Transcription of Mortality in the United States, 2016
1 NCHS Data Brief No. 293 december DEPARTMENT OF HEALTH AND HUMAN SERVICESC enters for Disease Control and PreventionNational Center for Health StatisticsMortality in the United States, 2016 Kenneth D. Kochanek, , Sherry L. Murphy, , Jiaquan Xu, , and Elizabeth Arias, findingsData from the National Vital Statistics System Life expectancy for the in 2016 was , a decrease of yearfrom 2015. The age-adjusted death ratedecreased by from per 100,000 standardpopulation in 2015 to in2016. Age-specific death ratesbetween 2015 and 2016increased for younger agegroups and decreased for olderage groups. The 10 leading causes ofdeath in 2016 remained thesame as in 2015, althoughunintentional injuries becamethe third leading cause, whilechronic lower respiratorydiseases became the fourth.
2 The infant Mortality rate infant deaths per 100,000live births in 2016 was notsignificantly different from the2015 rate. The 10 leading causes ofinfant death in 2016 remainedthe same as in report presents final 2016 Mortality data on deaths and death rates by demographic and medical characteristics. These data provide information on Mortality patterns among residents by variables such as sex, race and ethnicity, and cause of death. Life expectancy estimates, age-specific death rates, age-adjusted death rates by race and ethnicity and sex, 10 leading causes of death, and 10 leading causes of infant death were analyzed by comparing 2016 and 2015 final data (1).Keywords: life expectancy leading cause National Vital Statistics SystemHow long can we expect to live?In 2016 , life expectancy at birth was years for the total population a decrease of year from in 2015 (Figure 1).
3 For males, life expectancy changed from in 2015 to in 2016 a decrease of year. For females, life expectancy remained the same at 1. Life expectancy at selected ages, by sex: United States, 2015 and 2016 NOTES: Life expectancies for 2015 were revised using updated Medicare data; therefore, figures may differ from those previously published. Access data table for Figure 1 at: # : NCHS, National Vital Statistics System, expectancy (years) sexesAt age 65 FemaleMaleBoth sexesAt birthNCHS Data Brief No. 293 december 2017 2 Life expectancy for females was consistently higher than it was for males. In 2016 , the difference in life expectancy between females and males increased year from years in 2015 to years in 2016 , life expectancy at age 65 for the total population was years, an increase of year from 2015.
4 Life expectancy at age 65 increased year to years for females and was unchanged at years for males. The difference in life expectancy at age 65 between females and males increased year to years in 2016 from years in are the age-adjusted death rates for race ethnicity sex groups?The age-adjusted death rate for the total population decreased from per 100,000 standard population in 2015 to in 2016 (Figure 2). Age-adjusted death rates increased in 2016 from 2015 for non-Hispanic black males ( ). Age-adjusted death rates decreased for non-Hispanic white females ( ). Rates did not change significantly for non-Hispanic black females, non-Hispanic white males, Hispanic males, and Hispanic females from 2015 to per 100,000 standard populationFigure 2. Age-adjusted death rates for selected populations: United States, 2015 and 2016 1 Statistically significant decrease in age-adjusted death rate from 2015 to 2016 (p < ).
5 2 Statistically significant increase in age-adjusted death rate from 2015 to 2016 (p < ).NOTE: Access data table for Figure 2 at: # : NCHS, National Vital Statistics System, , , ,0001,200 FemaleMaleWhite femaleWhite maleBlack femaleBlack maleTo talNon-Hispanic Hispanic NCHS Data Brief No. 293 december 2017 3 What are the age-specific death rates for the total population?Death rates increased significantly between 2015 and 2016 for age groups 15 24 ( ), 25 34 ( ), 35 44 ( ), and 55 64 ( ) (Figure 3).Death rates decreased significantly for age groups 65 74 ( ), 75 84 ( ), and 85 and over ( ). 20162015 Deaths per 100,000 populationFigure 3. Death rates for the total population, by age group: United States, 2015 and 20161 Statistically significant increase in age-specific death rate from 2015 to 2016 (p < ).
6 2 Statistically significant decrease in age-specific death rate from 2015 to 2016 (p < ).NOTES: Rates are plotted on a logarithmic scale. Access data table for Figure 3 at: # : NCHS, National Vital Statistics System, , , , , , , , ,000100,00015 2425 3435 4445 5455 64 Age group (years) 65 7475 8485 and overNCHS Data Brief No. 293 december 2017 4 What are the leading causes of death?In 2016 , the 10 leading causes of death (heart disease, cancer, unintentional injuries, chronic lower respiratory diseases, stroke, Alzheimer s disease, diabetes, influenza and pneumonia, kidney disease, and suicide) remained the same as in 2015, although two causes exchanged ranks. Unintentional injuries, the fourth leading cause in 2015, became the third leading cause in 2016 , while chronic lower respiratory diseases, the third leading cause in 2015, became the fourth leading cause in 2016 (Figure 4) (1).
7 The 10 leading causes accounted for of all deaths in the United States in 2015 to 2016 , age-adjusted death rates decreased for 7 of 10 leading causes of death and increased for 3. The rate decreased for heart disease, for cancer, for chronic lower respiratory diseases, for stroke, for diabetes, for influenza and pneumonia, and for kidney disease. The rate increased for unintentional injuries, for Alzheimer s disease, and for suicide. 050100150200 SuicideKidney diseaseInfluenza andpneumoniaDiabetesAlzheimer s diseaseStrokeChronic lowerrespiratory diseasesUnintentional injuriesCancerHeart disease20162015 Deaths per 100,000 standard populationFigure 4. Age-adjusted death rates for the 10 leading causes of death in 2016 : United States, 2015 and 20161 Statistically significant decrease in age-adjusted death rate from 2015 to 2016 (p < ).
8 2 Statistically significant increase in age-adjusted death rate from 2015 to 2016 (p < ).NOTES: A total of 2,744,248 resident deaths were registered in the United States in 2016 . The 10 leading causes accounted for of all deaths in the United States in 2016 . Rankings for 2015 data are not shown. Causes of death are ranked according to number of deaths. Access data table for Figure 4 at: # : NCHS, National Vital Statistics System, Data Brief No. 293 december 2017 5 What are the leading causes of infant death?The infant Mortality rate (IMR) the ratio of infant deaths to live births in a given year is generally regarded as a good indicator of the overall health of a population. The IMR changed from infant deaths per 100,000 live births in 2015 to in 2016 , but this change was not statistically 10 leading causes of infant death in 2016 accounted for of all infant deaths in the United States.
9 The leading causes remained the same as in 2015 (Figure 5). The IMR for maternal complications decreased from infant deaths per 100,000 live births in 2015 to in 2016 . Mortality rates for other leading causes of infant death did not change hemorrhageDiseases of thecirculatory systemRespiratory distressof newbornBacterial sepsis of newbornCord and placentalcomplicationsUnintentional injuriesMaternal complicationsSudden infant deathsyndromeLow birth weightCongenital malformationsInfant deaths per 100,000 live birthsFigure 5. Infant Mortality rates for the 10 leading causes of infant death in 2016 : United States, 2015 and 2016 1 Statistically significant decrease in Mortality rate from 2015 to 2016 (p < ).NOTES: A total of 23,161 deaths occurred in children under age 1 year in the United States in 2016 , with an infant Mortality rate of infant deaths per 100,000 live births.
10 The 10 leading causes of infant death in 2016 accounted for of all infant deaths in the United States. A total of 23,455 infant deaths occurred in 2015, with an infant Mortality rate of infant deaths per 100,000 live births. Rankings for 2015 data are not shown. Causes of death are ranked according to number of deaths. Access data table for Figure 5 at: # : NCHS, National Vital Statistics System, Data Brief No. 293 december 2017 6 SummaryIn 2016 , a total of 2,744,248 resident deaths were registered in the United States 31,618 more deaths than in 2015. From 2015 to 2016 , the age-adjusted death rate for the total population decreased , but life expectancy at birth decreased year. Age-specific death rates between 2015 and 2016 increased for younger age groups and decreased for older age groups.