Mrs. Avinash's Science Class - Home
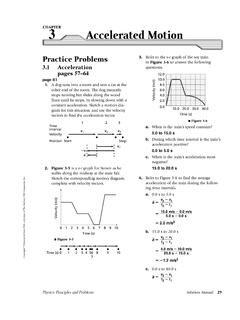
Kinematics-Motion Graphs Base your answers to questions 11 and 12 on the graph 14. The graph below shows the relationship between the below, which represents the motion ofa car during a 6-second time interval. Velocity vs. Time 15.0 È 10.0 2 5.0 0.0 0.0 2.0 4.0 6.0 Time (s) 11. What is the acceleration of the car at t=5.0 seconds? 0.0 m/s2 2.0m/s2
Tags:
Information
Domain:
Source:
Link to this page:
Related documents

Name: GCSE (1 – 9) Velocity Time Graphs - Maths Genie
www.mathsgenie.co.ukVelocity Time Graphs Name: _____ Instructions • Use black ink or ball-point pen. • Answer all questions. ... • Check your answers if you have time at the end ... Below is a sketch of the speed-time graph for the motion of the sprinter.
CHAPTER 3 Accelerated Motion - Mr. Nguyen's Website
nguyenmapleleaf.weebly.composition-time graphs of their motion? Both lines would have the same slope, but they would rise from the d-axis at different points, #15 m, and "15 m. b. What would be the difference(s) in their velocity-time graphs? Their velocity-time graphs would be identical. 14. Velocity Explain how you would use a velocity-time graph to find the time at

AP Calculus BC 2007 Scoring Guidelines - College Board
secure-media.collegeboard.orgThe graphs of f and g, which intersect at t = 1.617 and t = 5.076, are shown in the figure above. At time 0,t = the amount of water in the tank is 5000 gallons. ... θ= and interpret your answer in terms of the motion of the particle. (c) For the particle described in part (b), .

Unit 2 Kinematics Worksheet 1: Position vs. Time and ...
www.livingston.org4. a) Draw the velocity vs. time graph for an object whose motion produced the position vs time graph shown below at left. b) Determine the average velocity and average speed for the entire trip 5. For many graphs, both the slope of the plot and the area between the plot and the axes have physical meanings. a.
rd Grade Physical Science: Force & Motion on the Playground
www.ie.unc.eduSep 03, 2019 · motion and factors that affect motion. 3.P.1.1 Infer. changes in speed or direction resulting from forces acting on an object. 3.P.1.2 Compare. the relative speeds (faster or slower) of objects that travel the same distance in different amounts of time. 3.P.1.3 Explain. the effect of earth’s gravity on the motion of any object on or near the ...
Exercise 3 - Texas A&M University
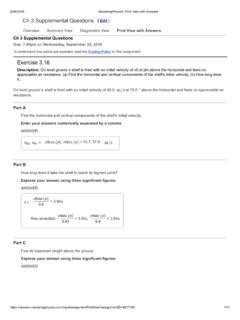
people.tamu.eduEnter your answers numerically separated by a comma. ANSWER: Part F At its highest point, find the horizontal and vertical components of its velocity. Enter your answers numerically separated by a comma. ANSWER: Exercise 3.19
Vector Calculus
mecmath.net1 Vectors in Euclidean Space 1.1 Introduction In single-variable calculus, the functions that one encounters are functions of a variable (usually x or t) that varies over some subset of the real number line (which we denote by R). For such a function, say, y=f(x), the graph of the function f consists of the points (x,y)= (x,f(x)).These points lie in the Euclidean plane, which, in the …

www.cusd80.com
www.cusd80.comDistance fin yards) Distance Cin yards} Distance tin yards) Distance fin yards} m o o o