Transcription of Multiple Hypothesis Testing: The F-test
1 Multiple Hypothesis Testing: The F-test MattBlackwellDecember3,20081 A bit of reviewWhen moving into the matrix version of linear regression, it is easy to lose sight of the big picture and getlost in the details of dot products and such. It is vital to take a step back and figure out where we are andwhat we are doing in order to keep ourselves grounded and understanding the start with apopulation, consisting of units (countries, registered voters, counties, &c). We obtaina sample from this population, which is ourdata. We want to learn something about the population fromthis sample. We call these parameters, or quantities of interest. In the beginning of class we were trying tofind, say, the percent of registered voters who voted in Fulton County (our parameter of the population).We put our data into anestimator(the sample mean) and get out anestimate(.)
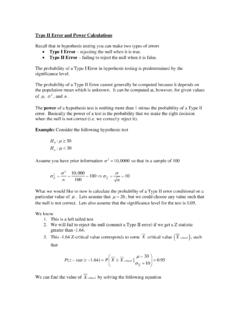
2 42). We can then usehypothesis tests and confidence intervals in deal with the uncertainty inherent in the sampling testing has us ask this: if we suppose some null Hypothesis is true, how likely is it that wewould have obtained this result from random sampling? We reject the null Hypothesis if we determine ourestimate is unlikely (the probability is less than , a small number) given the null. Confidence intervalscollect all of the null hypotheses that wecannotreject at some level; that is, these are the values of the trueparameters we think could have plausibly generated our observed said that we want to find out likely our data is under some Hypothesis . But, you may ask, how do weknow how likely our data is under some Hypothesis ? For example, we know that the sample mean, Xtendsto be Normally distributed around the true mean with standard error / n.
3 But don t actually know so we don t actually know this distribution. Promisingly, we do know the distribution ofZ= X / know that this had a standard Normal distribution. Thus, we could calculate theZfor some proposedvalue of and see how likely thatZwould be in the standard Normal. This is an example of a test statistic. For gov2k in Fall 2008. Parts are heavily borrowed (read: stolen) from past gov2k TFs, specifically Jens Hainmueller, RyanMoore and Alison TheF-testWe have seen ourt-statistic follows atdistribution with a degrees of freedom parameter. This fact hasbeen useful for Hypothesis testing, both of sample means and of regression coefficients. We are able totest, say, the Hypothesis that some variable has no effect on the dependent variable. All we do is calculateat-statistic for this null Hypothesis and our data and see if that test statistic is unlikely under the nulldistribution (the Student st-distribution).
4 Unfortunately, when we have more complicated hypotheses, this test no longer works. Hypotheses in-volving Multiple regression coefficients require a different test statistic and a different null distribution. Wecall the test statisticsF0and its null distribution theF-distribution, after Fisher (we call the wholetest anF-test, similar to thet-test). Again, there is no reason to be scared of this new test or are still just calculating a test statistic to see if some Hypothesis could have plausibly generated our Usage of theF-testWe use theF-test to evaluate hypotheses that involved Multiple parameters. Let s use a simple setup:Y= 0+ 1X1+ 2X2+ 3X3+ Test of joint significanceSuppose we wanted to test the null Hypothesis that all of the slopes are zero. That is, our null hypothesiswould beH0: 1= 0and 2= 0and 3= often write this more compactly asH0: 1= 2= 3= 0.
5 Note that this implies the followingalternative Hypothesis :H1: 16= 0or 26= 0or 36= is a test of the null that none of the independent variables have predictive power. We could useanother null such asH0: 1= 3= 0 to see if eitherX1orX3has predictive power, when controlling are often substantively interesting hypotheses. For example, if we wanted to know how economicpolicy affects economic growth, we may include several policy instruments (balanced budgets, inflation,2trade-openness, &c) and see if all of those policies are jointly significant. After all, our theories rarely telluswhichvariable is important, but rather a broad category of addition, we may have a series of dummy variables that all measure some qualitative grouping. Supposein the Fulton county data we had a dummy variable for each religion:Voted Catholic Protestant Jewish Other110100210001301000410100500010We could run a regression with each dummy variable to see the rate at which each group votes (if this isconfusing, take a look back at the lecture on dummy variables).
6 The coefficients will always be in comparisonto the omitted category, which may not be a useful test. It is usually more useful to test if there is anydifference between any of the groups. We can do that with a null Hypothesis that all of the religion coefficientsare equal to could also use these restrictions to test interaction or quadratic terms, as these will only have noeffect at all when both coefficients are all of their constituent coefficients are equal to that we could replace 0 with any other number in our null Hypothesis . Our theories often arenot specific enough to test some other null, but it does arise. With logged dependent variables, authorssometimes test the null that the coefficients are 1 (since the effect on the unlogged variable would be 0). tests of linear restrictionsThe joint significance tests of the previous section are important, but not the full extent of theF-test.
7 Wecan test general linear restrictions. For instance, we may want to test if two coefficients are significantlydifferent from one another. This null would beH0: 2 1= 0 or, equivalently,H0: 2= 1. Since wehave shown that the scale of the independent variable affects the size of the coefficient, it is important tonote that the independent variables for these coefficients should be on the same scale. For instance, youwould not want to test the null that the effect of years of education on income equals the effect of genderas they are on completely different scales. You may want to test the difference between the effect of yearsof education and the effect of years of experience, though. Those are on the same scale and the test hassubstantive is possible to have even more complicated linear restrictions, such asH0: 3 7 = 3 23 2= 1 , we would usually write this asH0: 3 7 = 3 2= 1 4.
8 These types of restrictions areobviously less common as our theories rarely give us such sharp predictions about our coefficients. Thesetypes of restrictions might be useful if we need to rescale some of the coefficients to make them Calculating theF-statisticWe showed what kinds of hypotheses we can test with theF-test in the previous section, but now we needto actually calculate the test statistic. The motivation is that we want to know the distribution of the teststatistic under the null hypotheses. Earlier we noted that null / nfollows at-distribution under the null thattrue mean of is null. This is the core of the more complicated null hypotheses in the previous sections, we will calculateF0, which will followanFdistribution under those nulls. We will deal with the simpler joint significance tests first, then moveon to the more general linear joint significance testsIf our null is of the form,H0: 1= 2=.
9 = k= 0, then we can write the test statistic in the followingway:F0=(SSRr SSRur)/qSSRur/(n (k+ 1)),whereSSRrstands for the sum of the suared residuals of the restricted model andSSRuris the same forthe unrestricted model. We also have thatnis the number of observations,kis the number of independentvariables in the unrestricted model andqis the number of restrictions (or the number of coefficients beingjointly tested).This terminology may seem a bit strange at first. We are restricting the general model by imposingsupposing that the null is true and removing variables from the model. Thus, the difference (SSRr SSRur)is telling us how much bigger the residuals are in the model where the null Hypothesis is true. If the residualsare a lot bigger in the restricted model, thenF0will also be big. When the residuals are bigger, we knowthat this means the fit of the regression is worse.
10 Thus,F0is big when the restriction makes the fit of theregression a lot worse which is exactly when we would question the null Hypothesis . If these variables reallyhad no predictive power, then removing them should not affect the residuals. We will discuss how bigF0needs to be to reject the null Hypothesis a bit general linear restrictionsThe general linear restrictions we wrote about can all be written in the following matrix form:H0:L =cwhere we can form the matricesLandcto fit our Hypothesis . Adam covered many examples of these inlecture, so I won t repeat them here. You also get practice of this in the homework. With this null Hypothesis ,we can write the test statistic asF0=(L c) [ 2L(X X) 1L ] 1(L c)qwhereqis the number of restrictions (the rows ofLandc). It seems like this obtuse piece of junk would bevery hard to get intuition about and that is correct, but we can try.