Transcription of Multiple Linear Regression - Johns Hopkins University
1 Multiple Linear RegressionSong GeBSN, RN, PhD CandidateJohns Hopkins University School of Biostatistics for Evidence based PracticeLearning ObjectivesBy the end of this module, you will be able to:1. Articulate assumptions for Multiple Linear regression2. Explain the primary components of Multiple Linear regression3. Identify and define the variables included in the Regression equation4. Construct a Multiple Regression equation5. Calculate a predicted value of a dependent variable using a Multiple Regression equationLearning Objectives Cont d6. Distinguish between unstandardized (B) and standardized (Beta) Regression coefficients7.
2 Distinguish between different methods for entering predictors into a Regression model (simultaneous, hierarchical and stepwise)8. Identify strategies to assess model fit9. Interpret and report the results of Multiple Linear Regression analysisReview of lecture two weeks ago Linear Regression assumes a Linear relationship between independent variable(s) and dependent variable Linear Regression allows us to predict an outcome based on one or several predictors Linear Regression allows us to explainthe interrelationships among variables Linear Regression is a parametric testHow to choose X and Y? Y can be regressed on X X can be regressed on Y The Regression is not symmetric The choice of which Regression to perform depends on the scientific question: Is X to be used to explain or predict Y?
3 Is Y to be used to explain or predict X? ( Does poor health status explain high pollution level?) Linear Regression Assumptions1. Independent variable can be any scale (ratio, nominal, etc.)2. Dependent variable need to be ratio/interval scale3. Dependent variable need to be normally distributed overall and normally distributed for each value of the independent variable4. If dependent variable is not normally distributed, we can transform itReview: Normal distributionExample of transformed dataPositively skewedNormally distributedMethodMath OperationGood for:Bad for:Logln(x)log10(x)Right skewed dataZero valuesNegative valuesSquare root xRight skewed dataNegative valuesSquarex2 Left skewed dataNegative valuesCube rootx1/3 Right skewed dataNegative valuesNot as effective as log transformReciprocal1/xMaking small values bigger and big values llZero valuesNegative Samples must be representative of the population6.
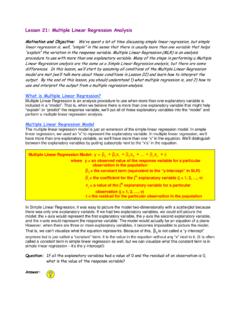
4 There is no multicollinearity: the interdependent variables are so strongly intercorrelated that they are indistinguishable from each otherIf VIF lies between 1 10, no multicollinearityIf VIF <1 or >10, then there is The relationship between x and y must be Linear . When two scores are graphed, they should tend to form a straight line. If that is not a Linear relationship, other methods must be For every value of X, the distribution of Y scores must have approximately equal variability (homoscedasticity) Multiple Linear Regression Recall student scores example from previous module What will you do if you are interested in studying relationship between final grade with midterm (or screening) score and other variables such as previous (undergraduate) GPA, GRE score and motivation?
5 A simple Linear Regression (SLR) cannot handle this A separate SLR with each explanatory (independent) variable will provide information in isolation You will need to use a Multiple Linear Regression (MLR) method to study them togetherMultiple Linear Regression A Multiple Linear Regression model shows the relationship between the dependent variable and Multiple (two or more) independent variables The overall variance explained by the model (R2) as well as the unique contribution (strength and direction) of each independent variable can be obtained In MLR, the shape is not really a line. If there are three variables, the shape is a plane, and if there are four or more variables, it is impossible to visualize or graph.
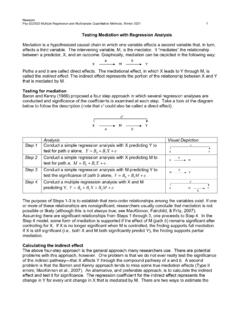
6 However, by convention, we still refer to the Regression equation as a Regression 'line'.MLR with Two Predictors Linear Regression Equation Sometimes also called multivariate Linear Regression for MLR The prediction equation isY = a+ b1X1+ b2X2+ b3X3+ bkXk There is still one intercept constant, a, but each independent variable ( , X1, X2, X3) has their own Regression coefficientReview: Simple Linear Regression Y is a Linear function of X Y = a + bx a = intercept b = slopeInterpretation of MLR CoefficientsInterpretation of MLR CoefficientsInterpretation of MLR CoefficientsGroup exercise: interpret B0, B1 and B2 Data are from children aged 1 to 5 years in the Variables Y is the child s arm circumference (cm) X1 is the age of the child (months) X2 is the height of the child (cm) Does arm circumference increase with increasing child age after controlling for child height?
7 Multiple Linear Regression model Y = B0 + B1 X1 + B2 X2 Answers B0= the estimated mean arm circumference when the values of age and height are zero B1= the change in the estimated mean arm circumference associated with each 1 month increase in age if height is unchanged B3= You do! Multiple Linear Regression Models We can get six critical pieces of information from an MLR: The overall significance of the model The variance in the dependent variable that comes from the set of independent variables in the model The statistical significance of each individual independent variable (controlling for the others) The direct effect (and direction of the effect) of each independent variable on the dependent variable The relative strength of the independent variables The Regression equation, which allows us to predict values of the dependent variable given values of the independent variablesThe overall piece.
8 R2(coefficient of determination) R2provides the proportion of variability explained by using X R2measures the ability to predict an individual Y using its X(s) Statistical significance of the overall model (Model F-test) Recall that R is population correlation coefficient Takes on values between -1 and +1 0 indicates no Linear association; 1 indicates a perfect positive Linear relationship; -1 indicates a perfect negative Linear relationshipR: population correlation output for R squareThe individual piece: Correlation coefficientF Test of Regression coefficient: Whether the independent variable associated with it is contributing significantly to the variance accounted for in the dependent variableGroup exercise Propose a research question that can be answered by MLR State under what assumptions do we use this statistical method?
9 State the formula and what B0, B1 and B2 stand for? Break We are interested in knowing if going to restaurants frequently (five or more times/week) can lead to higher cholesterol. We also know that age, gender, and race/ethnicity can affect cholesterol. How can we tell if going out to restaurants frequently, this factor alone, will affect cholesterol levels? Do age, gender, ethnicity, and going out to eat frequently all affect cholesterol levels? Dependent variable: cholesterol level Independent variables: age (years), gender (male/female), race/ethnicity (Black, White, Asian, or Hispanic), frequency of going out to eat (5+ times/week vs less than 5 times/week) Linear Regression Assumptions Linear Regression is a parametric method and requires that certain assumptions be met to be sample must be representative of the dependent variable must be of ratio/interval scale and normally distributed overall and normally distributed for each value of the independent every value of X, the distribution of Yscores must have approximately equal variability (homoscedasticity)
10 Relationship between Xand Ymust be independent variables are not very strongly inter-correlated (no multicollinearity)Creating Dummy Variables Using dummy variables is a way to express a nominal independent variable with Multiple categories by a series of dichotomous (binary) variables that compare one category to a different category that serves as the reference The number of dummy variables created will be one less than the number of categories of the variable One of the categories is chosen to serve as the reference category You then include all the dummy variables in the Regression model instead of the original categorical variableCreating Dummy Variables.