Transcription of Multivariate Analysis Homework 1
1 Multivariate Analysis Homework 1A49109720 Yi-Chen ZhangMarch 16, a bivariate normal population with 1= 0, 2= 2, 11= 2, 22= 1, and 12= (a) Write out the bivariate normal density.(b) Write out the squared generalized distance expression (x )T 1(x ) as afunction ofx1andx2.(c) Determine (and sketch) the constant-density contour that contains 50% of the (a) The Multivariate normal density is defined by the following (x) =1(2 )p/2| |1/2exp{ 12(x )T 1(x )}.In this question, we havep= 2,x=(x1x2), =( 1 2), =( 11 12 21 22), and 12= 12 11 22. Note that =(02), =(2 22 221),| |= 2 1 ( 22)2=32,| |1/2= 32, and 1=23(1 22 222).
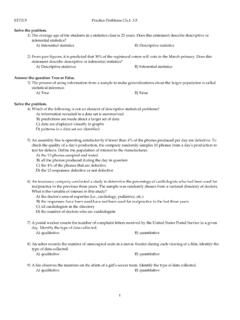
2 So the bivariate normal density isf(x) =1(2 )2/2 32exp{ 12(x1x2 2)23(1 22 222)(x1x2 2)}=1 6 exp{ 13(x21 2x1(x2 2) + 2(x2 2)2)}(b)(x )T 1(x ) =(x1x2 2)23(1 22 222)(x1x2 2)=23(x21 2x1(x2 2) + 2(x2 2)2).(c) For = , the solid ellipsoid of (x1,x2) satisfy (x )T 1(x ) 2p, =c2will have probability 50%. From the quantile function inRwe have 22, ( ,df=2)= , therefore,c= The eigenvalues of are( 1, 2) = ( , ) with eigenvectors(e1e2)=( ).Therefore, we have the axes as:c 1= andc 2= The contour isplotted in Figure 4 2024 2024x1x2 Figure 1: Contour that contains 50% of the ( , ) with T= (2, 3,1) and = 1 1 11 3 21 2 2 (a) Find the distribution of 3X1 2X2+X3.
3 (b) Relabel the variables if necessary, and find a 2 1 vectorasuch thatX2andX2 aT(X1X3)are (a) Leta= (3, 2,1)T, thenaTX= 3X1 2X2+X3. Therefore,aTX N(aT ,aT a),whereaT =(3 2 1) 2 31 = 13andaT a=(3 2 1) 1 1 11 3 21 2 2 3 21 = 9 The distribution of 3X1 2X2+X3isN3(13,9).(b) Leta=(a1a2)T, thenY=X2 aT(X1X3)= a1X1+X2 , letA=(010 a11 a2), thenAX=(X2Y) N(A ,A AT), whereA AT=(010 a11 a2) 1 1 11 3 21 2 2 0 a1110 a2 =(3 a1 2a2+ 3 a1 2a2+ 3a21 2a1 4a2+ 2a1a2+ 2a22+ 3)2 Since we want to haveX2andYindependent, this implies that a1 2a2+ 3 = we have vectora=(30)+c( 21),forc distributed asN3( , ), where T= (1, 1,2) and = 40 1050 1 02.
4 Whichof the following random variables are independent? Explain.(a)X1andX2(b)X1andX3(c)X2andX3(d ) (X1,X3) andX2(e)X1andX1+ 3X2 2X3 Sol.(a) 12= 21= 0,X1andX2are independent.(b) 13= 31= 1,X1andX3are not independent.(c) 23= 32= 0,X2andX3are independent.(d) We rearrange the covariance matrix and partition it. The new covariance matrix isas following: = 4 10 120005 It is clear that (X1,X3) andX2are independent.(e) LetA=(1 001 3 2), thenAX=(X1X1+ 3X2 2X3)andAX N(A ,A AT),whereA AT=(1 001 3 2) 40 1050 1 02 11030 2 =(4 66 61)It is clear thatX1andX1+ 3X2 2X3are not to Exercise and specify each of the following.
5 (a) The conditional distribution ofX1, given thatX3=x3.(b) The conditional distribution ofX1, given thatX2=x2andX3= use the result from textbook. LetX=(X1X2) N( , ) with =( 1 2)and =( 11 12 21 22)and| 22|>0. ThenX1 X2=x2 N( 1+ 12 122(x2 2), 11 12 122 21)3(a)X1 X3=x3 N(1 + ( 1)(2) 1(x3 2),4 ( 1)(2) 1( 1)) X1 X3=x3 N( 12x3+ 2,)(b)X1 X2=x2,X3=x3 N(1 +(0 1)(5 00 2) 1(x2 ( 1)x3 2),4 (0 1)(5 00 2) 1(0 1)) X1 X2=x2,X3=x3 N( 12x3+ 2,) ,X2,X3, andX4be independentNp( , ) random vectors.(a) Find the marginal distributions for each of the random vectorsV1=14X1 14X2+14X3 14X4andV2=14X1+14X2 14X3 14X4(b) Find the joint density of the random vectorsV1andV2defined in (a).
6 Sol.(a) By result in the textbook,V1andV2have the following distributionNp(n i=1ci ,(n i=1c2i) )Then we haveV1 Np(0,14 ) andV2 Np(0,14 ).(b) Also by result ,V1andV2are jointly Multivariate normal with covariance matrix (n i=1c2i) (bTc) (bTc) (n j=1b2j) ,withc= (14, 14,14, 14)Tandb= (14,14, 14, 14)T. So that we have the joint distri-bution ofV1andV2as following:(V1V2) N2p((00),(14 0014 )) the maximum likelihood estimates of the 2 1 mean vector and the 2 2 covariancematrix based on the random sampleX= 3 64 45 74 7 from a bivariate normal the random samplesX1,X2,X3, andX4are from normal population, the maximumlikelihood estimates of and are Xand1nn i=1(Xi X)(Xi X)T.
7 Therefore, = X=(46)and =144 i=1(Xi X)(Xi X)T=(1/2 1/41/4 3/2) ,X2, .. ,X20be a random sample of sizen= 20 from anN6( , ) each of the following completely.(a) The distribution of (X1 )T 1(X1 )(b) The distributions of Xand n( X )(c) The distribution of (n 1)SSol.(a) (X1 )T 1(X1 ) is distributed as 26(b) Xis distributed asN6( ,120 )and n( X )is distributed asN6(0, )(c) (n 1)Sis distributed as Wishart distribution20 1 i=1 ZiZTi, whereZi N6(0, ).We write this asW6(19, ), , Wishart distribution with dimensionality 6, degreesof freedom 19, and covariance matrix . ,..,X60be a random sample of size 60 from a four-variate normal distributionhaving mean and covariance.
8 Specify each of the following completely.(a) The distribution of X(b) The distribution of (X1 )T 1(X1 )(c) The distribution ofn( X )T 1( X )(d) The approximate distribution ofn( X )TS 1( X )Sol.(a) Xis distributed asN4( ,160 ).(b) (X1 )T 1(X1 ) is distributed as 24.(c)n( X )T 1( X ) is distributed as 24.(d) Since 60 4,n( X )TS 1( X ) can be approximated as the annual rates of return (including dividends) on the Dow-Jones industrialaverage for the years 1996-2005. These data, multiplied by 100, are these 10 observations to complete the following.
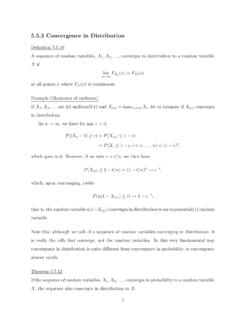
9 (a) Construct aQ-Qplot. Do the data seem to be normally distributed? Explain.(b) Carry out a test of normality based on the correlation coefficientrQ. Let the signif-icance level be = (a) TheQ-Qplot of this data is plotted in Figure 2. It seems that all the sample quantilesare close the theoretical quantiles. However, theQ-Qplots are not particularlyinformative unless the sample size is moderate to large, for instance,n 20. Therecan be quite a bit of variability in the straightness of theQ-Qplot for small samples,even when the observations are known to come from a normal 1001020 Theoretical QuantilesSample QuantilesFigure 2: NormalQ-Qplot(b) From (4-31) in the textbook, theqQis defined byrQ= nj=1(x(j) x)(q(j) q) nj=1(x(j) x)2 nj=1(q(j) q)2 Using the information from the data, we haverQ= TheRcode of thiscalculation is compiled in Appendix.
10 From Table in the textbook we know thatthe critical point to test of normality at the 10% level of significance correspondington= 9 and = is between and SincerQ= >the criticalpoint, we do not reject the hypothesis of gives the agex1, measured in years, as well as the selling pricex2, measuredin thousands of dollars, forn= 10 used cars. These data are reproduced as (a) Use the results of Exercise to calculate the squared statistical distances(xj x)TS 1(xj x),j= 1,2,..,10, wherexTj= (xj1,xj2).(b) Using the distances in Part (a), determine the proportion of the observations fallingwithin the estimated 50% probability contour of a bivariate normal distribution.