Transcription of Multivariate Statistical Analysis - STAT - Home
1 Multivariate Statistical Analysis 1. Aspects of Multivariate Analysis 2. Principal Components 3. Factor Analysis 4. Discrimination and Classification 5. ClusteringJohnson, , Wichern, (1982): Applied Multivariate Statistical Analysis ,Prentice Aspects of Multivariate AnalysisMultivariate data arise wheneverp 1variables are recorded. Values of thesevariables are observed forndistinct item, individuals, or experimental use the notationxijto indicate the particular value of theith variable thatis observed on thejth item, or ,nmeasurements onpvariables are displayed asp nrandommatrixX:Item 1 Item 2..Itemj ..ItemnVariable 1:x11x12.. x1j.. x1nVariable 2:x21x22.. x2j.. :xi1xi2.. xij.. :xp1xp2.. xpj.. xpn2 Estimating Moments:Suppose, E(X) = and cov(X) = are the population moments.
2 Based on asample of sizen, these quantities can be estimated by their empirical versions:Sample Mean:xi=1nn j=1xij, i= 1, .. , pSample Variance:s2i=sii=1n 1n j=1(xij xi)2, i= 1, .. , pSample Covariance:sik=1n 1n j=1(xij xi)(xkj xk), i= 1, .. , p , k= 1, .. , p .3 Summarize all elementssikinto thep psample variance-covariance matrixS=(sik)i, further, that thep ppopulation correlation matrix is estimated bythe sample correlation matrixRwith entriesrik=sik siiskk, i= 1, .. , p , k= 1, .. , p ,whererii= 1for alli= 1, .. , p.> aimu <- (" ", header=TRUE)> attach(aimu)> options(digits=2)> mean(aimu[ ,3:8])age height weight fvc fev1 fevp30 177 77 553 460 834> cov(aimu[ ,3:8])age height weight fvc fev1 fevpage 110 -233 -302 -17 351 275 16 325 212 -233 5817 4192 -302 4192 4347 -21 -87 162 > cor(aimu[ ,3:8])age height weight fvc fev1 fevpage :Consider the pointP= (x1, x2)in the plane.
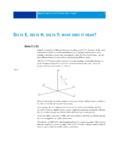
3 The straight line (Euclidian)distance,d(O, P), fromPto the originO= (0,0)is (Pythagoras)d(O, P) = x21+ general, ifPhaspcoordinates so thatP= (x1, x2, .. , xp), the Euclidiandistance isd(O, P) = x21+x22+ + distance between 2 arbitrary pointsPandQ= (y1, y2, .. , yp)is given byd(P, Q) = (x1 y1)2+ (x2 y2)2+ + (xp yp) coordinate contributes equally to the calculation of the Euclidian is often desirable to weight the distanceshould account for differences in variation and we havenpairs of measurements on 2 independent variablesx1andx2:> X <- mvrnorm(30, mu=c(0, 0), Sigma=matrix(c(9,0,0,1), 2, 2)); plot(X) 6 4 20246 6 4 20246X[,1]X[,2]Variability inx1direction is much largerthan inx2direction! Values that are agiven deviation from the origin in thex1direction are not assurprisingasare values seems reasonable to weight anx2coordinate more heavily than anx1coordinate of the same value whencomputing the distance to the the Statistical distance from the standardized coordinatesx 1=x1 s11andx 2=x2 s22asd(O, P) = (x 1)2+ (x 2)2= (x1 s11)2+(x2 s22)2= x21s11+ can be generalized to accommodate the calculation of Statistical distancefrom an arbitrary pointP= (x1, x2)to anyfixedpointQ= (y1, y2).
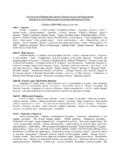
4 If thecoordinate variables vary independent of one other, the distance fromPtoQisd(P, Q) = (x1 y1)2s11+(x2 y2) extension to more than 2 dimensions is (x1, x2, .. , xp)andQ= (y1, y2, .. , yp). Assume again thatQis Statistical distance fromPtoQisd(P, Q) = (x1 y1)2s11+(x2 y2)2s22+ +(xp yp)2spp. The distance ofPto the origin is obtained by settingy1=y2= =yp= 0. Ifs11=s22= =spp, the Euclidian distance is appropriate. 2 1012 2 1012x1x2 Consider a set of paired measurements(x1, x2)withx1=x2= 0, ands11= 4, s22= 1. Supposethex1measurements are unrelated to measure the squared distance of an arbitraryP= (x1, x2)to(0,0)byd2(O, P) =x21/4 +x22 points with constant distance 1 satisfy:x41/4 +x22/1 = 1, an Ellipse centered at(0,0).9 This definition of Statistical distance still does not include most of the importantcases because of the assumption of independent coordinates.
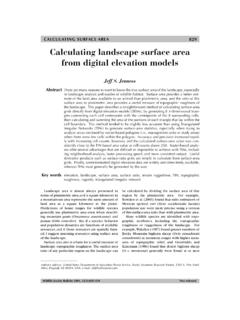
5 > X <- mvrnorm(30, mu=c(0, 0), Sigma=matrix(c(1, , ,9), 2, 2))> plot(X); abline(h=0, v=0); abline(0, 3); abline(0, -1/3) 6 4 20246 6 4 20246x1x2 x~1x~2 Here, thex1measurements do not varyindependently ofx2. The coordinatesexhibit a tendency to be large or smalltogether. Moreover, the variability inthex2directions is larger than is a meaningful measure ofdistance? Actually, we can use whatwe have already introduced!But before, we only have to rotate thecoordinate system through the angle and label the rotated axes x1and , we define the distance of a pointP= (x1, x2)from the origin(0,0)asd(O, P) = x21 s11+ x22 s22,where siidenotes the sample variance computed with the (rotated) measures of distance can be useful, provided they satisfy the (P, Q) =d(Q, P), (P, Q)>0ifP6=Q, (P, Q) = 0ifP=Q, (P, Q) d(P, R) +d(R, Q),Rbeing any other point different Components (PCA)Now we try to explain the variance-covariance structure through a fewlinearcombinations of the originalpvariablesX1, X2.
6 , Xp(data reduction).Let a random vectorX= (X1, X2, .. , Xp)thavep ppopulation variance-covariance matrix var(X) = .Denote the eigenvalues of by 1 2 p the arbitrary linear combinations with fixed vectors`iY1=`t1X=`11X1+`21X2+ +`p1 XpY2=`t2X=`12X1+`22X2+ +` `tpX=`1pX1+`2pX2+ +`ppXp12 For thesevar(Yi) =var(`tiX) =`ti `icov(Yi, Yk) =cov(`tiX,`tkX) =`ti `kWe define asprincipal componentsthose linear combinationsY1, Y2, .. , Yp,which areuncorrelatedand whose variances are aslargeas increasing the length of`iwould also increase the variances, we restrict oursearch onto vectors`i, which are of unit length, j`2ij=`ti`i= first principal component is the linear combination`T1 Xthat maximizesvar(`t1X)subject to`t1`1= second principal component is the linear combination`T2 Xthat maximizesvar(`t2X)subject to`t2`2= 1and with cov(`t1X,`t2X) = 0(uncorrelated withthe first one).
7 Principal component is the linear combination`TiXthat maximizesvar(`tiX)subject to`ti`i= 1and with cov(`tiX,`tkX) = 0, fork < i(uncorrelated with all the previous ones).How to find all these vectors`i?We will use well known some results from matrix 1:Let var(X) = and let have the eigenvalue-eigenvector pairs( 1,e1),( 2,e2), .. ,( p,ep), where 1 2 p 0. Then theithprincipal component,i= 1, .. , p, is given byYi=etiX=e1iX1+e2iX2+..+ this choicesvar(Yi) =eti ei= i,cov(Yi, Yk) =eti ek= , the principal components are uncorrelated and have variances equal to theeigenvalues of .If some iare equal, the choice of the corresponding coefficient vectorsei, andhenceYi, are not 2:LetY1=et1X,Y2=et2X,..,Yp=etpXbe the principal 11+ 22+ + pp=p i=1var(Xi) = 1+ 2+ + p=p i=1var(Yi).
8 Thus, thetotal population varianceequals the sum of the , the proportion of total variance due to (explained by) thekthprincipal component is0< k 1+ 2+ + p<1If most ( 80 to 90%) of the total population variance (for largep) canbe attributed to the first one, two, or three principal components, then thesecomponents canreplacethe originalpvariables without much loss of magnitude ofeikmeasures the importance of thekth variable to theithprincipal component. In particular,eikis proportional to the correlation 3:IfY1=et1X,Y2=et2X,..,Yp=etpXare the principal componentsfrom the variance-covariance matrix , then Yi,Xk=eki i kkare the correlation coefficients between the componentsYiand the is informative to consider principal components derived from Multivariate normalrandom variables.
9 SupposeX Np( , )having density functionf(x| , ) = (2 ) p/2| | 1/2exp( 12(x )t 1(x )).Then the centered ellipsoids of constant density are(x )t 1(x ) = the two-dimensional casex= (x1, x2)tthis equals11 212[(x1 1 11)2+(x2 2 22)2 2 12(x1 1 11)(x2 2 22)]= ellipsoids have axes c iei,i= 1, .. , :Supposex= (x1, x2)t N2( , ), with = (0,0)tand =( 11= 9 12= 9/4 21= 9/4 22= 1)giving 12= (9/4)/ 9 1 = 3 eigen- Analysis of results in> sigma <- matrix(c(9, 9/4, 9/4, 1), 2, 2)> e <- eigen(sigma, symmetric=TRUE); e$values[1] $vectors[,1] [,2][1,] [2,] 3 2 10123 3 2 10123x1x2# check length of eigenvectors> e$vectors[2,1]^2+e$vectors[1,1]^2[1] 1> e$vectors[2,2]^2+e$vectors[1,2]^2[1] 1# slopes of major & minor axes> e$vectors[2,1]/e$vectors[1,1][1] > e$vectors[2,2]/e$vectors[1,2][1] # endpoints of of major&minor axes> sqrt(e$values[1])*e$vectors[,1][1] > sqrt(e$values[2])*e$vectors[,2][1] results also hold forp 2.
10 Set =0in what 1x=1 1(et1x)2+1 2(et2x)2+ +1 p(etpx)2,=1 1y21+1 2y22+ +1 py2pand this equation defines an ellipsoid (since the iare positive) in a coordinatesystem with axesy1, y2, .. , yplying in the directions ofe1,e2, .. ,ep. If 1is the largest eigenvalue, then the major axes lies in the direction ofe1. Theremaining minor axes lie in the directions defined bye2, .. ,ep. Thus the principalcomponents lie in the directions of the axes of the constant density Components obtained from Standardized VariablesInstead of usingX= (X1, X2, .. , Xp)twe now calculate the principalcomponents fromZ= (Z1, Z2, .. , Zp)t, whereZi=Xi i matrix notation this equalsZ=(V1/2) 1(X ),where the diagonal standard deviation matrixV1/2is defined asV1/2= pp.