Transcription of NACE SALARY SURVEY
1 NATIONAL ASSOCIATION OF COLLEGES AND EMPLOYERS | WINTER 2021 SALARY SURVEY | 1 SALARY SURVEYWINTER 2021 Starting SALARY projections for Class of 2021 new college graduatesData reported by employersSALARIES BY MAJORp. 9 salaries BY INDUSTRYp. 27 salaries BY REGIONp. 36 NATIONAL ASSOCIATION OF COLLEGES AND SALARY Projections For all Degree Levels ASSOCIATEBACHELOR S MASTER S DOCTORALNATIONAL ASSOCIATION OF COLLEGES AND EMPLOYERS | WINTER 2021 SALARY SURVEY | 1 TABLE OF CONTENTS About the SURVEY 2 How to Read SALARY SURVEY 4 Executive Summary 5 Starting SALARY by Academic Major 9 Starting SALARY by Major and Industry 19 Starting SALARY by Industry and Major 27 Starting SALARY by Region and Major 36 Appendix 50 2021 NATIONAL ASSOCIATION OF COLLEGES AND EMPLOYERS.
2 ALL RIGHTS | WINTER 2021 SALARY SURVEY | NATIONAL ASSOCIATION OF COLLEGES AND EMPLOYERSABOUT THE SURVEYThe Winter 2021 SALARY SURVEY report features annual SALARY projections for Class of 2021 college graduates. The figures reported are for base salaries only and do not include bonuses, commissions, fringe benefits, or overtime rates. The report provides the detailed SALARY projections by academic major and degree level, along with breakouts by both industry and geographic contained in the report were obtained by surveying NACE employer members from September 14, 2020, through November 30, 2020. A total of 139 surveys were returned a percent response rate. Of those responding, percent of respondents were from the New England region, percent were from the Plains region, percent were from the Rocky Mountain/Far West region, percent were from the Southwest region, percent were from the Southeast region, percent were from the Mideast region, and percent were from the Great Lakes region.
3 A list of respondents by industry and size, and a partial list of organizations that supplied data for this report can be found in the SURVEY (ISSN 1520-8648) is available to individuals holding membership in the National Association of Colleges and Employers; it is also available on a subscription basis. The SALARY SURVEY report is published three times a year January, July, and October by the National Association of Colleges and Employers, 62 Highland Ave., Bethlehem, PA 18017-9085. For more information, see or contact NACE at STAFFD irector of Research, Public Policy, and Legislative Affairs Edwin W. KocAssistant Director of Research and Public Policy Joshua KahnResearch Manager Andrea J. KonczResearch Associate Angelena GalbraithResearch Assistant Anna LongenbergerNATIONAL ASSOCIATION OF COLLEGES AND EMPLOYERS | WINTER 2021 SALARY SURVEY | 3 ISSUES OF SALARY SURVEY FOR THE CLASS OF 2021 The Winter issue features starting SALARY projections by major from employer-provided data.
4 The Winter 2021 report is the first report for the Class of 2021. Data are available by major, industry, and region. There are also data for advanced-degree candidates; the report includes data for 40 master s and 17 doctoral degree Fall issue reports data from participating institutions; the data are provided to the schools by their graduates. In this sense, the data are early returns on First-Destination SURVEY SALARY data. The report includes data by major and region. The Fall 2021 issue will provide actual starting SALARY data for the Class of Summer issue serves as the final report for the previous year s graduating class. The report features data provided through the national First-Destination SURVEY initiative; the data represent actual starting salaries (not projections) reported by graduates to their institutions. Data are by major, region, and Carnegie Classification.
5 The Summer 2021 issue is the final report on starting salaries for the Class of 2020. The Summer 2022 SALARY SURVEY will serve as the final report for the Class of DATA FOR THE CLASS OF 2021 REPORTWHATDATA SOURCEF irst Report Winter 2021 Pre-graduation projected starting salariesEmployersSecond Report Fall 2021 Early results, post-graduation actual starting salariesStudents/SchoolsFinal Report Summer 2022 Final results, post-graduation actual starting salariesFirst-Destination SURVEY (Students/Schools)4 | WINTER 2021 SALARY SURVEY | NATIONAL ASSOCIATION OF COLLEGES AND EMPLOYERSHOW TO READ SALARY SURVEYASSOCIATE / BACHELOR S / MASTER S / DOCTORALSTARTING SALARY BY ACADEMIC MAJOR | PAGE 10, 11, 15, 18In this section, you will find the average starting SALARY according to the major field of study, with no regard to the type of employer reporting the SALARY . Refer to this section when you want to know the starting SALARY for a graduate holding a degree in a specific discipline, such as accounting or computer SALARY BY MAJOR AND INDUSTRY | PAGE 20, 25 This section shows data first by the major field of study, then by the type of employer (industry) reporting the salaries .
6 Employer types are listed in alphabetical order under each major. See this section when you want the average starting SALARY reported by a specific type of employer to a graduate earning a degree in a specific major. (Example: Average SALARY that chemical [pharmaceutical] manufacturing firms are reporting for chemical engineering graduates.)STARTING SALARY BY INDUSTRY AND MAJOR | PAGE 28, 34 This section contains the same basic information as Starting salaries by Major and Industry, but in a different order. You will see data by a specific type of employer (industry), then according to the average SALARY by major field of study. Industries are arranged in alphabetical order. Majors are listed under each industry in the typical report order by broad category, then alphabetically within the category. Use this section to find the average starting SALARY reported by a specific type of employer to a graduate in a specific major.
7 (Example: Majors hired by construction firms and their corresponding average starting salaries .)STARTING SALARY BY REGION AND MAJOR | PAGE 37, 45, 49In this section, you will find the average starting SALARY according to the major field of study within seven geographic regions (New England, Mideast, Great Lakes, Plains, Southeast, Southwest, and Rocky Mountain/Far West. Note: For the master s and doctoral degree levels, regions have been combined due to limited data.) The regional data are based upon the locations of the participating organizations that supplied information for the majors within each region. The majors are reported in typical report order, by broad category, then alphabetically within the category. Averages are provided strictly by major field of study with no regard to the type of employer reporting the SALARY . Refer to this section when you want to know the starting SALARY for a graduate holding a degree in a specific discipline in a regional location, such as mechanical engineering majors hired by participants in the ASSOCIATION OF COLLEGES AND EMPLOYERS | WINTER 2021 SALARY SURVEY | 5 EXECUTIVE SUMMARYSTARTING SALARY PROJECTIONS FOR THE CLASS OF 2021 Bachelor s Degree GraduatesAs we recently closed out a disruptive and unpredictable 2020 due to the COVID-19 pandemic, the average starting SALARY projections for the Class of 2021 reveal some much-needed optimism on the part of employers.
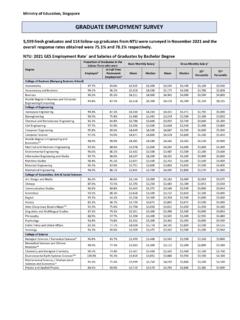
8 In this Winter 2021 SALARY SURVEY report, all reported categories of majors show increases, albeit some of them are on the smaller side. (See Figure 1.) Graduates earning degrees in the computer sciences field are one exception to these small increases in starting SALARY projections. The average SALARY projection for these Class of 2021 graduates is $72,173, which is a climb of from last year s projection of $67,411 for the Class of 2020. Nearly half of SURVEY respondents plan to hire computer science graduates; this demand and large jump in salaries could possibly be due to the greater need for technology prompted by the new virtual world we live and work in due to the pandemic. All three of the individual reported computer sciences majors reflect similar increases: computer science ( ), information sciences and systems ( ), and software applications ( ). While the increase in average starting SALARY projections for engineering graduates is just , they are expected to be the second highest paid majors, with an overall SALARY projection of $71,088.
9 Petroleum engineering graduates ($83,860) have the category s top projected SALARY . Following closely behind are the two computer-related engineering degrees: software engineering ($76,955) and computer engineering ($76,890). Their average SALARY projections have risen and , respectively. FIGURE 1 / AVERAGE salaries BY DISCIPLINE / BACHELOR S DEGREESBROAD CATEGORY2021 SALARY PROJECTION2020 SALARY PROJECTION% CHANGEC omputer Sciences$72,173 $67,411 $71,088 $69,961 & Sciences$63,316 $62,488 Sciences$59,919 $57,425 $59,500 $53,617 $58,869 $57,939 $58,174 $56,484 & Natural Resources$54,857 $53,504 reported majors within the math and sciences category show both increases and decreases, which is keeping the overall increase to just This slight increase brings the overall average SALARY projection to $63,316. The average projection for math majors ($67,360) is higher this year, while the average SALARY projection for chemistry majors ($59,625) is down 3% from last year s average.
10 It is important to note that data are very limited within this category, as all but one reported major (mathematics) have less than 10 reported SALARY overall average SALARY projection for business majors is up to $58,869. Despite the fact that management information systems graduates have the highest SALARY projection of the group, their average remains practically level, rising just , from $63,445 to $63,565. The demand for accounting majors is evident in this report. Not only are they the major most in demand at the bachelor s degree level (see Figure 2), but their average SALARY projection has jumped by more than 10%, from $52,734 last year to $58,508 this year. This is a steep climb from last year, when the projected SALARY increase for Class of 2020 accounting graduates was just 6 | WINTER 2021 SALARY SURVEY | NATIONAL ASSOCIATION OF COLLEGES AND EMPLOYERSThe average SALARY projection for Class of 2021 graduates earning social sciences degrees ($59,919) is higher than last year s average ($57,425).