Transcription of Name: GCSE (1 – 9) Velocity Time Graphs - Maths Genie
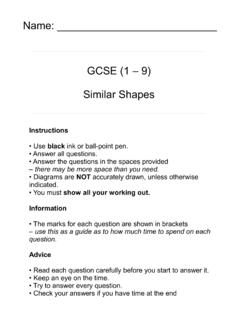
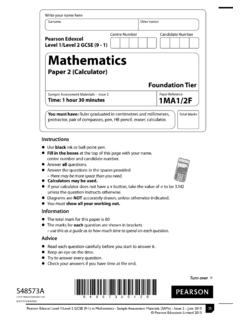
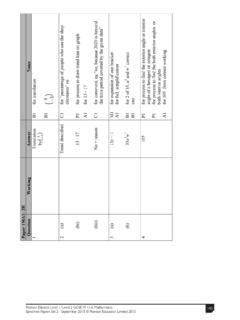
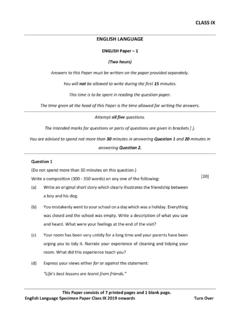
1 gcse (1 9) Velocity time GraphsName: _____Instructions Use black ink or ball-point pen. Answer all questions. Answer the questions in the spaces provided there may be more space than you need. Diagrams are NOT accurately drawn, unless otherwise indicated. You must show all your working The marks for each question are shown in brackets use this as a guide as to how much time to spend on each Read each question carefully before you start to answer it. Keep an eye on the time . Try to answer every question. Check your answers if you have time at the end14121086420 time in seconds5101520253035404550556065ytA car travels between two sets of traffic diagram represents the Velocity / time graph of the car leaves the first set of traffic lights.(a)Use the graph to find the Velocity of the car after 15 seconds.(b)Calculate an estimate for the acceleration of the car, in m/s2, after 10 (1)..(2) toy car is placed on the floor of a sports moves in a straight line starting from travels with constant acceleration for 4 seconds reaching a Velocity of 5 then slows down with constant deceleration of 1m/s2 for 2 then hits a wall and )Work out the total distance travelled by the toy ) Draw a Velocity - time graph for the toy (3)(3) (m s ) 19uO42025time (s)A sprinter runs a race of 200 total time for running the race is 25 is a sketch of the speed- time graph for the motion of the :a)The acceleration in the first 4 seconds of the raceb)The distance covered by the sprinter in the first 20 seconds of the racec)The value of (3).
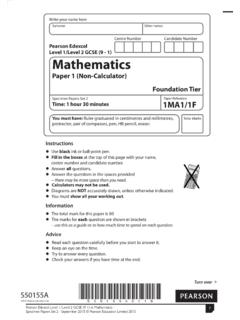
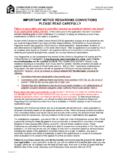
2 (2)..(2) (m s 1)t (s)O732 Below is a sketch of the speed- time graph of a cyclist moving on astraight road over a 7 second :a)The acceleration for the first 3 secondsb)The distance covered by the cyclist over the 7 second (2)..(2) sprinter runs a race of 200 total time for running the race is is a sketch of the speed- time graph for the motion of the :a)The maximum speed of the sprinter during the raceb)The distance covered by the sprinter in the first 5 seconds of the (4)..(2)5. Here is the Velocity - time graph of a car for 50 out the average acceleration during the 50 the units of your the time during the 50 seconds whenthe instantaneous acceleration = the average accelerationYou must show your working on the (2)..(2)6.