Transcription of Name: Honors Chemistry Section: Lab: Endothermic and ...
1 Name: Honors Chemistry section : Lab: Endothermic and exothermic reactions Many chemical reactions give off energy. Chemical reactions that release energy are called exothermic reactions . Some chemical reactions absorb energy and are called Endothermic reactions . You will study one exothermic and one Endothermic reaction in this experiment. In Part I, you will study the reaction between citric acid solution and baking soda. An equation for the reaction is: H3C6H5O7(aq) + 3 NaHCO3(s) 3 CO2(g) + 3 H2O(aq) + Na3C6H5O7(aq) In Part II, you will study the reaction between magnesium metal and hydrochloric acid. An equation for this reaction is: Mg(s) + 2 HCl(aq) H2(g) + MgCl2(aq) Another objective of this experiment is for you to become familiar with using the DataMate data-collection program on the TI Graphing Calculator.
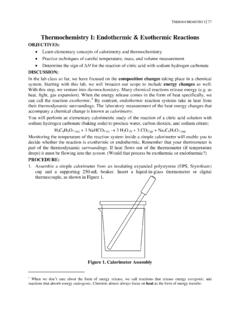
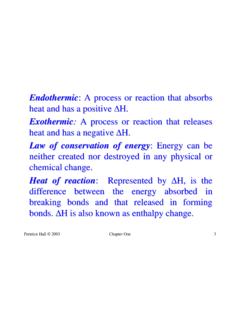
2 In this experiment, you will use the program to collect and display data as a graph or list, to examine your experimental data values on a graph, and to print graphs and data lists. Figure 1 Preparations Problem What types of energy changes occur in chemical reactions ? Objectives Observing energy changes in chemical reactions Using Vernier probes to collect and process data Using specific heat to calculate energy changes Materials LabPro or CBL 2 interface Styrofoam cup TI Graphing Calculator 250-mL baker DataMate program citric acid, H3C6H5O7, solution Temperature Probe Sodium hydrogen carbonate, NaHCO3 50-mL graduated cylinder hydrochloric acid, HCl, solution balance magnesium, Mg Roles Record the names make sure this is included in your lab report, too!
3 Project Manager _____ Reads directions, keeps track of time, keeps group on task Quality Control Manager _____ Approves data table, checks data quality, checks calculations Materials Manager _____ Gets and returns materials, supervises sharing of materialsSafety Wear goggles. Be careful not to use chipped or broken glassware. Hydrochloric acid solutions are caustic and may cause skin irritation. Wear safety goggles when working with these solutions. Immediately wash any spills or splashes on your skin. Call your teacher. Do the Experiment PROCEDURE 1. Copy the data table into your lab notebook. Be sure to record your observations and all relevant data. Part I Citric Acid plus Baking Soda 2. Plug the Temperature Probe into Channel 1 of the LabPro or CBL 2 interface. Use the link cable to connect the TI Graphing Calculator to the interface.
4 Firmly press in the cable ends. 3. Place a Styrofoam cup into a 250-mL beaker as shown in Figure 1. Measure out 30 mL of citric acid solution into the Styrofoam cup. Place the Temperature Probe into the citric acid solution. 4. Weigh out g of solid sodium hydrogen carbonate on a piece of weighing paper. 5. Turn on the calculator and follow these steps to start the DATAMATE program. TI-73 and TI-83 Calculators: Press PRGM, then press the calculator key for the number that precedes the DATAMATE program (usually 1). Press ENTER. You are now at the main screen of the program. Press CLEAR to reset the program. TI-83 Plus Calculators: Press APPS, then press the calculator key for the number that precedes the DATAMATE program. Press ENTER. You are now at the main screen of the program. Press CLEAR to reset the program. TI-86 Calculators: Press PRGM, press F1 to select <NAMES>, and press a menu key to select <DATAM> (usually F1).
5 Press ENTER. You are now at the main screen of the program. Press CLEAR to reset the program. TI-89, TI-92, and TI-92 Plus Calculators: Press 2nd [VAR-LINK]. Use or the cursor pad to scroll down to datamate , then press ENTER. Press ) to complete the open parenthesis that follows datamate on the entry line and press ENTER. You are now at the main screen of the program. Press CLEAR to reset the program. 6. Set up the calculator and interface for the Temperature Probe. a. Select SETUP from the main screen. b. If the calculator displays a Temperature Probe in CH 1, proceed directly to Step 7. If it does not, continue with this step to set up your sensor manually. c. Press ENTER to select CH 1. d. Select TEMPERATURE from the SELECT SENSOR menu. e. Select the Temperature Probe you are using (in C) from the TEMPERATURE menu.
6 7. Set up the data-collection mode. a. To select MODE, press once and press ENTER. b. Select TIME GRAPH from the SELECT MODE menu. c. Select CHANGE TIME SETTINGS from the TIME GRAPH SETTINGS menu. d. Enter 6 as the time between samples in seconds. e. Enter 50 as the number of samples. The length of the data collection will be 5 minutes. f. Select OK to return to the setup screen. g. Select OK again to return to the main screen. 8. You are now ready to begin collecting data. a. Select START on the main screen. b. After about 20 seconds have elapsed, add the baking soda to the citric acid solution. Gently stir the solution with the Temperature Probe to ensure good mixing. c. A real-time graph of temperature vs. time will be displayed on the calculator screen during data collection. d. Temperature readings (in C) can also be monitored in the upper-right corner of the graph.
7 E. Data collection will stop after 5 minutes, and a graph of temperature vs. time will be displayed. 9. Dispose of the reaction products as directed by your instructor. 10. Use the or keys (or the cursor pad on the TI-92) to examine the data points along the displayed curve of temperature vs. time. As you move the cursor right or left, the time (X) and temperature (Y) values of each data point are displayed below the graph. Determine the initial temperature, t1, and final (or minimum) temperature, t2. Record the temperature values in your data table (round to the nearest C). 11. Store the data from the first run so that it can be used later. To do this: a. Press ENTER to return to the main screen, then select TOOLS. b. Select STORE LATEST RUN from the TOOLS MENU. Part II Hydrochloric Acid Plus Magnesium 12.
8 Measure out 30 mL of HCl solution into the Styrofoam cup. Place the Temperature Probe into the HCl solution. Note: The Temperature Probe must be in the HCl solution for at least 30 seconds before doing Step 15. 13. Obtain a piece of magnesium metal from your instructor. 14. Choose START on the main screen to begin data collection. After about 20 seconds have elapsed, add the Mg to the HCl solution. Gently stir the solution with the Temperature Probe to ensure good mixing. Caution: Do not breathe the vapors. Data collection will stop after 5 minutes. 15. Dispose of the reaction products as directed by your instructor. Rinse the Temperature Probe. 16. Examine the data points along the displayed curve of temperature vs. time. Determine the initial temperature, t1, and the final (or maximum) temperature, t2. Record the temperature values in your data table (round to the nearest C).
9 17. You can also examine the data by viewing the data lists directly. To do this, press ENTER to return to the main screen, and select QUIT. Then follow this procedure for your calculator: TI-73, TI-83, and TI-83 Plus Calculators To view the lists, press STAT to display the EDIT menu and then select Edit. Press to scroll down through the data lists L1 (time) and L2 (temperature) for Part II. Note: When you choose to repeat a data collection, as you did in Step 11 of this experiment, the temperature data in L2 of the first data run will be stored in L3. You can view the data for Part I of the experiment in L1 and L3. TI-86 Calculators To view the lists, press 2nd [STAT] and select <EDIT> by pressing F2. Press to scroll down through the data lists L1 (time) and L2 (temperature) for Part II. Note: When you choose to repeat a data collection, as you did in Step 11 of this experiment, the temperature data in L2 of the first data run will be stored in L3.
10 You can view the data for Part I of the experiment in L1 and L3. TI-89, TI-92, and TI-92 Plus Calculators To view the data matrix, press APPS, select Data/Matrix Editor, then Current. Move the cursor down through the data lists c1 (time) and c2 (temperature) for Part II. Note: When you choose to repeat a data collection, as you did in Step 11 of this experiment, the temperature data of the first data run will be displayed in c3. You can view the data for Part I of the experiment in c1 and c3. 18. A good way to compare the curves is to view both sets of data on one graph. a. Turn on the calculator and start the DATAMATE program. b. Select GRAPH from the main screen, then press ENTER. c. Select MORE, then select L2 AND L3 VS L1 from the MORE GRAPHS menu. d. Both temperature runs should now be displayed on the same graph.