Transcription of NAMIBIA - OECD.org
1 NamibiaWindhoekkey figures Land area, thousands of km2:823 Population, thousands (2000): 1 757 GDP per capita, $ (2000):1 955 Life expectancy (1995-2000): Illiteracy rate (2001) 10/01/02 15:13 Page 229 NAMIBIA 10/01/02 15:13 Page 230 African Economic Outlook OECD/BAD 2002231 NAMIBIA , AMIDDLE INCOME COUNTRY with an incomeper capita of $1 955 and a total population of less than2million, is still an economy largely based on theexploitation of natural resources such as diamonds,agriculture and fishing. Since its independence in 1990,public policy has been struggling with the developmentof other economic activities.
2 However, the pace ofgrowth has remained stable at moderate levels per cent a year and is expected to stay the samein 2001 and 2002. So far, the main structural changehas been the increase of state intervention in theeconomy with government services accounting foralmost a quarter of gross domestic product. On thepolitical side, land reform is increasingly gainingmomentum, and black empowerment, although highon the government agenda, has given mixedresults. Yet, NAMIBIA is an uneven societywith one of the highest levels of incomeinequality.
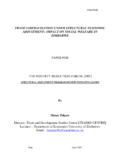
3 With poverty delineated alongfunctional groups and by urban-ruraldualism, social cohesion is still a highlysensitive issue. So far, the main structural change in NAMIBIA has beenthe increase of state intervention in the economy1995199619971998199920002001(e)20 02(p)-10-8-6-4-20246810 Figure 1- Real GDP GrowthSource:Authors estimates and predictions based on domestic authorities Economic DevelopmentsDuring the last six years (1995-2001) Namibiaexperienced an average growth rate of per cent, per cent below the target of public policy, butslightly above the rate of population growth resultingin an average increase of per cent in real GDP percapita over the period.
4 Real growth has been sustainedby the developments of the export-oriented primarysectors (agriculture, fisheries and mining) and by thelarge non-tradable government sector. In 2000 outputgrowth declined slightly from per cent in 1999 per cent in 2000. The mining sector is still the backbone of theeconomy accounting for 50 per cent of merchandiseexports earnings. After a rapid expansion in 1999,diamond output, which represents the bulk of mining,dipped sharply during 2000. The sector has beentransformed in the last years: the proportion ofdiamonds mined off-shore reached 57 per cent in performance of the mining sector in 2000 washelped by the reopening of a copper mine that led toan increase of per cent in value added from non-diamond mining.
5 The outlook for the sector appearspositive, since the opening of a major new zinc mineNAMIBIA 10/01/02 15:13 Page 231 African Economic Outlook OECD/BAD 2002232 Namibiaat the end of 2002 is likely to have an enormous impacton the country s economic growth. After a two-year period of decline, the agriculturesector made a significant turnaround in 1999 and2000 registering an average growth rate of percent. This good performance was largely the outcomeof the recovery in livestock. However, sectoralperformance remains volatile owing to climaticconditions.
6 The fishing sector, after a poor year in1999, grew by per cent in 2000 with white fishperforming especially well. The role of the government in the economy hascontinuously expanded since independence in 1990:excluding parastatals for which statistics are notavailable on an aggregated basis government servicesin 2000 accounted for almost a fourth of GDP. In2000 the sector grew by per cent, much higherthan the average for the last five years. The manufacturing industry a priority forgovernment policy has not increased significantlyduring the last five years, although in 2000 the sector soutput increased by per cent.
7 Its contribution togrowth is still unstable given that almost 80 per centof the sector is engaged in food-related industries (foodprocessing, fish processing and brewing). However,the good performance of the non-food processing sub-sector was largely the cause of the encouraging growthin 2000. The structure of domestic demand is changing asa result of declining investment. Indeed, investment199019911992199319941995199619 97199819992000 Africa Namibia05001000150020002500 Figure 2- GDP Per Capita in NAMIBIA and in Africa ($ current)Source:Authors estimates based on IMF and domestic authorities 1- Demand Composition (percentage of GDP)Source:Authors estimates and predictions based on Central Bureau of Statistics (e)2002 (p)Gross capital 10/01/02 15.
8 13 Page 232 African Economic Outlook OECD/BAD 2002233 NAMIBIA -2024681012141618 Agriculture Fishing Mining and quarrying Manufacturing Electricity and water Construction Wholesale and retail trade Hotels and restaurants Transport, storage and communications Financial and business services Government services Other servicesGDP at factor cost Volume Price ValueFigure 4- Sectoral Contribution to GDP Growth, 2000 Source:Authors estimates based on Central Bureau of Statistics andquarryingManufacturingElectricity and waterConstructionWholesale andretail tradeHotelsandrestaurantsTransport, storageand communicationsFinancial andbusiness servicesGovernment services6%5%15%3%2%11%10%2%7%14%24%1%Fig ure 3- GDP by Sector in 2000 Source:Authors estimates based on Central Bureau of Statistics by per cent in 2000.
9 The lack of adynamic investment demand coupled with the lack offinancial intermediaries capable of channelling savingsfrom pension and life insurance funds towardinvestment projects are largely responsible for suchtrends. As a result, with investment lower than nationalsavings, NAMIBIA is experiencing capital outflows mainlydirected to South Africa. Beside those developments,the share of public consumption in GDP is still verylarge accounting for per cent of GDP, among thehighest in the region and in developing trends are expected in 2001 and 2002.
10 NAMIBIA 10/01/02 15:13 Page 233 African Economic Outlook OECD/BAD 2002234 NamibiaMacroeconomic PolicyFiscal and Monetary PoliciesSince 1995 Namibian economic policy has beenconducted in terms of a medium-term frameworkderived from the first National Development Plan(NDP1) covering the period 1995/96 to 1999 main national development goals included a 5 percent average annual real growth target, the creation ofemployment, the reduction of inequalities in incomedistribution and the tackling of poverty. Theachievements have so far been disappointing.