Transcription of NatioNal CommuNity PharmaCists assoCiatioN - …
1 NatioNal CommuNity PharmaCists assoCiatioN FINANCIALS. 2009 NCPA Digest sponsored by cardinal health Member Edition Project Editor Donna West-Strum, RPh, PhD. Associate Professor, Department of Pharmacy Administration The University of Mississippi Oxford, Mississippi Project Director and Financial Editor Devin Stone, MA. Health Care Economist NatioNal CommuNity PharmaCists assoCiatioN Alexandria, Virginia Creative Enjua Claude Senior Director, Creative Sarah Diab Senior Designer Contributors Chris Linville Director and Managing Editor, America's Pharmacist NatioNal CommuNity PharmaCists assoCiatioN Alexandria, Virginia Bryan Ziegler, PharmD, MBA. Assistant Dean and Clinical Assistant Professor South Carolina College of Pharmacy Columbia, South Carolina Amod Athavale Graduate Student, Department of Pharmacy Administration The University of Mississippi Oxford, Mississippi Copyright 2009 NatioNal CommuNity PharmaCists assoCiatioN (NCPA ), Alexandria, VA, USA.
2 All Rights Reserved. No right of reproduction without the prior written consent of NCPA. [October 2009]. Dear Valued NCPA Member: We are pleased to present you with the complete financial information of the 2009 NCPA Digest, sponsored by Cardinal Health. In today's pharmacy environment, it is more important than ever that you take an in-depth look at your pharmacy's financial picture against NatioNal pharmacy averages to come up with a real-world strategy for your pharmacy's future. Outlined here is an approach to assist you in successfully integrating the key Digest findings into an action plan for your pharmacy. Step 1: Use your financial statements to assess your present situation and identify any significant trends. If you participated in the survey, then you will receive a free benchmarking analysis from NCPA using the data you submitted.
3 Step 2: Compare your company's current status to: Your own past performance (prior years' financial statements). Ratios for the Top 25 percent (Tables 2 4). Ratios for All Pharmacies (Tables 2 4). Ratios for pharmacies in your sales category (Tables 5 7). Step 3: Identify the strengths and weaknesses of your company and identify possible causes for the problems. Refer to the Guide to Benchmarking available only to NCPA members at Step 4: Set goals for the year and develop a written action plan for achieving better results. Step 5: Implement plan and monitor its progress. Review the plan monthly and evaluate its performance and focus on additional areas that may require improvement. Revise the plan periodically if necessary. Step 6: Repeat the entire process, making corrections and adjustments for the differences between actual results and measurable goals.
4 Financial management is an ongoing process, not a short-term project. Step 7: Work with your fellow PharmaCists , your internal management team, professional accountant, and outside business advisers to gain the most from their expertise and this process. We know that you will find the information contained in these pages useful for your pharmacy. For more information about NCPA's various management offerings, including continuing education seminars, publications, and web resources, visit NCPA's website at or contact the NCPA Management Institute at 800-544-7447.. 2009 NCPA Digest sponsored by cardinal health Table of Contents 6 Executive Summary 9 Methodology 10 Operating Results 19 Sales Volume Summary 25 Cost of Dispensing 27 Third-Party Prescriptions 34 Geographic Summary 38 Rural versus Metropolitan Locations 41 Overview of Financial Statements and Performance Measures Figures 1.
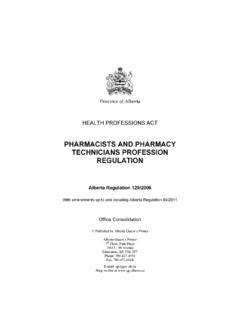
5 Average annual sales (in thousands) per pharmacy location, 10-year trend 7. 2. Cost of Dispensing By Geographical Region 25. 3. Third-Party Prescription Activity Five-Year Trend 27. Tables 1. Averages of pharmacy operations, 10-year trend 7. 2. 2008 Common-Sized (Average) Income Statement, Percentage of Total Sales 16. 3. 2008 Median Financial Benchmarks 17. 4. 2008 Common-Sized (Average) Balance Sheet, Percentage of Total Assets 18. 5. 2008 Common-Sized (Average) Income Statement, Percentage of Total Sales By Sales Volume 22. 6. 2008 Median Financial Benchmarks By Sales Volume 23. 7. 2008 Common-Sized (Average) Balance Sheet, Percentage of Total Assets By Sales Volume 24. 8. Summary of Third-Party Prescription Activity 27. 9. 2008 Common-Sized (Average) Income Statement, Percentage of Total Sales By Third-Party Prescription Activity 28.
6 10. 2008 Median Financial Benchmarks By Third-Party Prescription Activity 29. 11. 2008 Common-Sized (Average) Balance Sheet, Percentage of Total Assets By Third-Party Prescription Activity 30. 12. 2008 Common-Sized (Average) Income Statement, Percentage of Total Sales Portion of Prescriptions Covered by Medicare Part D 31. 13. 2008 Median Financial Benchmarks Portion of Prescriptions Covered by Medicare Part D 32. 14. 2008 Common-Sized (Average) Balance Sheet, Percentage of Total Assets Portion of Prescriptions Covered by Medicare Part D 33. 15. 2008 Common-Sized (Average) Income Statement, Percentage of Total Sales By Geographic Region 35. 16. 2008 Median Financial Benchmarks By Geographic Region 36. 17. 2008 Common-Sized (Average) Balance Sheet, Percentage of Total Assets By Geographic Region 37.
7 18. 2008 Common-Sized (Average) Income Statement, Percentage of Total Sales Metropolitan vs. Rural 38. 19. 2008 Median Financial Benchmarks Metropolitan vs. Rural 39. 20. 2008 Common-Sized (Average) Balance Sheet, Percentage of Total Assets Metropolitan vs. Rural 40. Table of Contents . Executive Summary The 2009 NCPA Digest, sponsored by Cardinal Health Independent CommuNity Pharmacy At-A-Glance provides an annual overview of independent CommuNity 2008. pharmacy, including a comprehensive review of the financial Average number of pharmacies in operations of the nation's independent CommuNity pharma- which each independent owner has cies for 2008. ownership Independent CommuNity pharmacies are all pharmacist- Value of inventory as cost and as a percentage of sales owned, privately held businesses but vary in practice set- Prescription inventory $242,621 ting.
8 They include not only single-store operations but Other inventory $39,963 other independent CommuNity pharmacist-owned opera- Total inventory $282,584 tions such as chain, franchise, compounding, long-term care (LTC), specialty, and supermarket pharmacies. In Annual rate of inventory turnover 2008, 14 percent of participating pharmacies had total sales over $ million, 31 percent with sales between $ and Annual rate of prescription inventory turnover ZWO $ million, 24 percent with sales between $ and $ ^ million, and 31 percent with sales under $ million. Median sales per square foot R Pc[PY^P^. Prescription sales per square foot $3,732. YNZXP. Breakdown by Volume of Sales Other sales per square foot $85. Total sales per square foot $1,161. Number of prescriptions dispensed per pharmacy location ?]
9 Z_LW >LWP^. New prescriptions 28,412 46%. :aP] ! 8 TWWTZY. _Z ! 8 TWWTZY. Renewed prescriptions 33,967 54%. _Z 8 TWWTZY Total prescriptions 62,379 100%. 8 TWWTZY Z] 7P^^. Average prescription charge $ . Number of hours and days per week per location Hours open per week 55. ZWO Days open per week 6. ^ . R Pc[PY^P^ Sales activity per hour open In 2008 independent CommuNity pharmacy represented an YNZXP Prescription sales per hour $1,266. $88 billion marketplace, with 93 percent of sales for inde- pendents derived from prescription drugs. Although many Other sales per hour $91. independents continue to face slim margins from private Number of prescriptions dispensed 22. per hour third-party contracts and government reimbursement programs, independents have strived to reduce their over- Percentage of total prescriptions covered by: head costs by operating a more efficient business, investing Government programs (Medicaid 44%.)
10 In labor-saving technologies, and keeping payroll costs or Medicare Part D). down. In 2008 there were 22,728 independent CommuNity Other third-party programs 44%. pharmacies employing over 260,000 workers and providing high quality services and niche markets which are greatly Percentage of generic prescriptions 65%. valued by patients. dispensed )! . ! . # ! . '! ! .. 2009 NCPA Digest, sponsored by Cardinal Health %! . Figure 1 Average Annual Sales (in Thousands) Per Pharmacy Location % !!! ## . " . # ! ! .. $ !!! #. # . $! $!". # !!! " !!! $$$ ! " #. ! An overview of the average independent CommuNity phar- of pharmacies in which each independent owner has macy is provided in Table 1. In general, the average inde- ownership is pendent CommuNity pharmacy location dispensed 62,379. prescriptions (200 per day) in 2008, which is a slight increase The NCPA Digest, sponsored by Cardinal Health data have for over 75 years, providing an opportunity been collected from last year's prescription volume of 61,052.