Transcription of National Compensation Survey: Occupational …
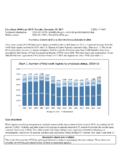
1 National Compensation survey : Occupational Wages in the United States, june 2006 Department of labor bureau of labor statistics june 2007 Summary 07-03 arnings averaged $ per hour in june 2006 for civilian workers in the United States. Average hourly earnings were lower for private industry workers ($ ) than for State and local government workers ($ ). Part of this difference can be explained by differences in the Occupational and industrial composition of the two sectors. For example, high-paying professional and related occupations are relatively more common in State and local government than in private industry.
2 (See Appendix table 1 for the number of workers by Occupational group.) The National Compensation survey (NCS) measures straight-time average hourly earnings for civilian workers (nonfarm private industry and State and local government). The NCS has undergone a number of significant changes since National estimates were published for june 2005. The most important were the introduction of the 2000 Standard Occupational Classification (SOC) system, the 2002 North American Industry Classification System (NAICS), and the post stratification of survey sample weights to reflect current employment by industry.
3 See the Technical Note for more details. This summary presents aggregated National earnings data from the NCS for: Sectors of the economy (civilian, private industry, and State and local government) Worker and establishment characteristics Detailed Occupational earnings for full-time civilian workers The data in this summary are a subset of Occupational earnings data from the NCS. Table 1 highlights the major types of data available by sector of the economy civilian, private industry, and State and local government. Table 2 provides data for specific occupations, including separate estimates for hourly earnings, weekly hours and earnings, and annual hours and earnings.
4 Worker characteristics. Earnings varied by Occupational group; full- and part-time status; union and nonunion status; and time and incentive pay. Among the five major Occupational groups, average hourly earnings ranged from $ for service workers to $ for management, professional, and related employees. Average hourly earnings for sales and office workers were $ , while for natural resources, construction, and maintenance workers, the average was $ The average hourly earnings for production, transportation, and material moving workers was $ Earnings were higher for full-time than for part-time workers, averaging $ per hour and $ per hour, respectively.
5 The NCS classifies workers as full and part time based on the employer s definition of those terms. Pay also was higher for union workers ($ per hour) than for nonunion workers ($ per hour). Incentive workers (whose wages are based, at least in part, on productivity payments such as piece rates, commissions, and production bonuses) earned, on average, $ per hour. In contrast, time workers, whose wages are based solely on an hourly rate or salary, averaged $ per hour. Earnings also varied among occupations within occupa-tional groups. For example, average hourly earnings for full-time sales and related occupations were $ , with a range from $ for cashiers to $ for securities, commodities, and financial service sales agents.
6 Among architecture and engineering occupations, average annual salaries were $66,063, ranging from $36,933 for cartographers and photogrammetrists to $99,834 for petroleum engineers. (See table 2.) Establishment characteristics. Earnings generally varied by the employment size of the establishment and by industry. In private industry, average hourly earnings ranged from $ in establishments employing between 1 and 49 workers to $ in those with 500 workers or more. Workers employed in goods-producing industries earned more ($ ) than did those in service-providing industries ($ ).
7 E 2 Additional Occupational earnings data. More detailed information on earnings by occupation will be published later this year in the National bulletin and will be available for the nine census divisions. National data will include: Occupational detail for workers in private industry and State and local government Occupational earnings by work level Occupational earnings by percentiles Occupational earnings for workers in nonprofit establishments Occupational earnings for union and nonunion workers Occupational earnings for State government and local government separately Occupational earnings for supervisory workers Occupational earnings for workers by establishment size Detailed information for most of these series will also be available for the census
8 Divisions. The National bulletin and census division publications will be available on the Internet site: Table 1. Mean hourly earnings1 and weekly hours for selected worker and establishment characteristics, United States, June20062 Worker and establishmentcharacteristicsCivilianwork ersPrivate industryworkersState and local governmentworkersHourly earningsMeanweeklyhours4 Hourly earningsMeanweeklyhours4 Hourly earningsMeanweeklyhours4 MeanRelativeerror3(percent)MeanRelativee rror3(percent)MeanRelativeerror3(percent )All $ $ $ characteristics5,6 Management, professional, and related .. , business, and financial.
9 And related .. and office .. and related .. and administrative support .. resources, construction, andmaintenance .. and extraction .. , maintenance, and repair .. , transportation, and materialmoving .. and material moving .. time .. time .. Establishment characteristicsGoods producing ..7()7()7( ) ()7()7()Service providing ..7()7()7( ) ()7()7()1-49 workers .. workers .. workers .. workers or more .. are the straight-time hourly wages or salaries paid to employees. Theyinclude incentive pay, cost-of-living adjustments, and hazard pay. Excluded are premiumpay for overtime, vacations, holidays, nonproduction bonuses, and tips.
10 The mean iscomputed by totaling the pay of all workers and dividing by the number of workers,weighted by hours. 2 The survey covers all 50 states and the District of Columbia. Data were collectedbetween December 2005 and January 2007. The average month of reference was relative standard error (RSE) is the standard error expressed as a percent ofthe estimate. It can be used to calculate a "confidence interval" around a sampleestimate. For more information about RSEs, see Technical weekly hours are the hours an employee is scheduled to work in a week,exclusive of are classified as working either a full-time or a part-time schedule basedon the definition used by each establishment.