Transcription of National Healthcare Quality and Disparities Report ...
1 National Healthcare Quality and Disparities Report CHARTBOOK ON. RURAL HEALTH CARE. Agency for Healthcare Research and Quality Advancing Excellence in Health Care This document is in the public domain and may be used and reprinted without permission. Citation of the source is appreciated. Suggested citation: National Healthcare Quality and Disparities Report chartbook on rural health care. Rockville, MD: Agency for Healthcare Research and Quality ; October 2017. AHRQ Pub. No. 17(18)-0001-2-EF. National Healthcare Quality AND. Disparities Report CHARTBOOK. ON RURAL HEALTH CARE. DEPARTMENT OF. HEALTH AND HUMAN SERVICES. Agency for Healthcare Research and Quality 540 Gaither Road Rockville, MD 20850. AHRQ Publication No. 17(18)-0001-2-EF. October 2017. ACKNOWLEDGMENTS. The National Healthcare Quality and Disparities Report (QDR) is the product of collaboration among agencies across the Department of Health and Human Services (HHS). Many individuals guided and contributed to this effort.
2 Without their magnanimous support, the Report would not have been possible. Specifically, we thank: Authors: Barbara Barton (AHRQ), Irim Azam (AHRQ). Primary AHRQ Staff: Gopal Khanna, Sharon Arnold, Jeff Brady, Erin Grace, Karen Chaves, Nancy Wilson, Darryl Gray, Barbara Barton, Doreen Bonnett, and Irim Azam. HHS Interagency Workgroup for the QDR: Girma Alemu (HRSA), Nancy Breen (NIH-NIMHD), Victoria Cargill (NIH), Hazel Dean (CDC), Kirk Greenway (IHS), Chris Haffer (CMS-OMH), Edwin Huff (CMS), DeLoris Hunter (NIH-NIMHD), Sonja Hutchins (CDC), Ruth Katz (ASPE), Shari Ling (CMS), Darlene Marcoe (ACF), Tracy Matthews (HRSA), Ernest Moy (CDC-NCHS), Curt Mueller (HRSA), Ann Page (ASPE), Kathleen Palso (CDC-NCHS), Potter (ASPE), Asel Ryskulova (CDC-NCHS), Adelle Simmons (ASPE), Marsha Smith (CMS), Caroline Taplin (ASPE), Emmanuel Taylor (NCI), Nadarajen Vydelingum (NIH-NCI), Barbara Wells (NIH-NHLBI), and Ying Zhang (IHS). Data Support Contractors: Booz Allen Hamilton (BAH), Social & Scientific Systems (SSS), Truven Health Analytics, and Westat, Inc.
3 RURAL HEALTH CARE. This Rural Health Care Chartbook is part of a family of documents and tools that support the National Healthcare Quality and Disparities Reports (QDR). The QDR includes annual reports to Congress mandated in the Healthcare Research and Quality Act of 1999 ( 106-129). These reports provide a comprehensive overview of the Quality of health care received by the general population and Disparities in care experienced by different racial, ethnic, and socioeconomic groups. The purpose of the reports is to assess the performance of our health system and to identify areas of strengths and weaknesses in the health care system along three main axes: access to health care, Quality of health care, and priorities of the National Quality Strategy. The reports are based on more than 250 measures of Quality and Disparities covering a broad array of health care services and settings. Data are generally available through 2013, although rates of uninsurance have been tracked through the first half of 2015.
4 The reports are produced with the help of an Interagency Work Group led by the Agency for Healthcare Research and Quality (AHRQ) and submitted on behalf of the Secretary of Health and Human Services (HHS). This chartbook contains: Overview of the QDR. Overview of residents of rural areas, one of the priority populations of the QDR. Summary of trends in health care Quality and Disparities for rural populations Tracking of access and Quality measures for rural populations. Key Findings of the 2016 QDR. Quality of health care improved generally from 2000 through 2014-2015 but the pace of improvement varied by priority area: Person-Centered Care: About 80% of measures improved overall. Patient Safety: Almost two-thirds of measures improved overall. Healthy Living: About 60% of measures improved overall. Effective Treatment: More than half of measures improved overall. Care Coordination: About half of measures improved overall. Care Affordability: About 70% of measures did not change.
5 Overall, some Disparities were getting smaller from 2000 through 2014-2015, but Disparities persist, especially for poor and uninsured populations in all priority areas.: While 20% of measures show Disparities getting smaller for Blacks and Hispanics, most Disparities have not changed significantly for any racial or ethnic groups. More than half of measures show that poor and low-income households had worse care than high-income households; for middle-income households, more than 40% of measures show worse care than high-income households. Nearly two-thirds of measures show that uninsured people had worse care than privately insured people. National Healthcare Quality and Disparities Report | 1. Rural Health Chartbook on Rural Health This chartbook includes: Summary of trends in health care Quality and Disparities for rural populations. Figures illustrating select measures of Access to Health Care and 6 priority areas, including Care Affordability, Care Coordination, Effective Treatment, Healthy Living, Patient Safety, and Person-Centered Care, for rural populations.
6 Introduction and Methods contains information about methods used in the chartbook. A Data Query tool ( ) provides access to all data tables. 2006 NCHS Urban-Rural Classification System Metropolitan Large central Counties in a metropolitan statistical area of 1 million or more population: metropolitan 1. That contain the entire population of the largest principal city of the metropolitan statistical area, or 2. Whose entire population resides in the largest principal city of the metropolitan statistical area, or 3. That contain at least 250,000 of the population of any principal city in the metropolitan statistical area. Large fringe Counties in a metropolitan statistical area of 1 million or more population that metropolitan do not qualify as large central. Medium Counties in a metropolitan statistical area of 250,000 to 999,999 population. metropolitan Small Counties in a metropolitan statistical area of 50,000 to 249,999 population. metropolitan Nonmetropolitan Micropolitan Counties in a micropolitan statistical area.
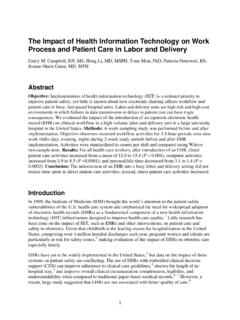
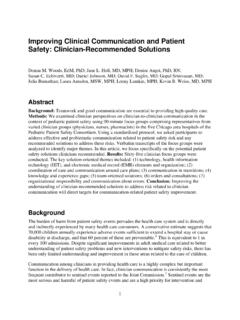
7 Noncore Counties not in a micropolitan statistical area. 2 | National Healthcare Quality and Disparities Report Rural Health Urban-Rural Classification Scheme Map Map Map Applying Applying NCHS. NCHS Urban-Rural Urban-Rural Classification Classification Scheme Scheme Source: Source:Ingram IngramD, D,Franco FrancoS. NCHS urban-rural urban-ruralclassification classificationscheme schemefor forcounties. NationalCenter Centerfor forHealth HealthStatistics. VitalHealth HealthStat Stat 2(154).2012. 2(154). Use of NCHS Urban-Rural Classification Scheme in This Chartbook This chartbook compares residents of nonmetropolitan (rural) areas with residents of large fringe metropolitan (suburban) areas: Residents of suburban areas tend to have higher Quality health care and better outcomes. The National Center for Health Statistics (NCHS) Urban-Rural Classification Scheme is used to guide analyses involving geographic location. The 2013 NCHS classification system is derived from data gathered from three sources: the Office of Management and Budget metropolitan and nonmetropolitan designations, the Rural-Urban Continuum and Urban Influence coding systems, and the Census.
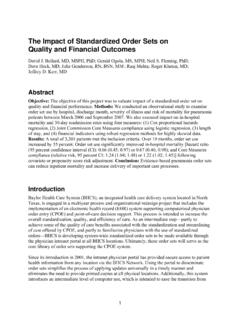
8 The NCHS scheme includes six urbanization categories, including: Four metropolitan county designations: Large Central Metropolitan Large Fringe Metropolitan Medium Metropolitan Small Metropolitan National Healthcare Quality and Disparities Report | 3. Rural Health Two nonmetropolitan county designations: Micropolitan Noncore Residents of Rural Areas According to the Census Bureau, in 2016, approximately 60 million Americans ( ). lived in a nonmetropolitan, or rural, area. This figure included about 13 million children under 18 and 47 million adults. Although rural residents make up less than one-fifth of the population, 65% of the 3,142. counties are classified as nonmetropolitan (Meit, et al., 2014). This figure includes 445 frontier counties ( Census Bureau, 2010) that have a population density of fewer than 7 people per square mile. Health Issues in Rural Areas Compared with their urban counterparts, residents of rural counties are: Older, Poorer, More likely to be overweight or obese, and Sicker (Meit, et al.)
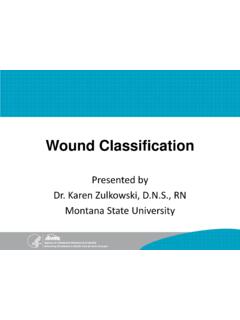
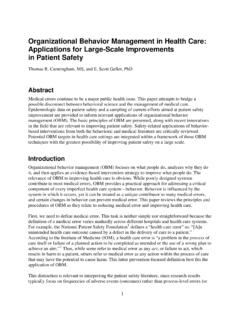
9 , 2014). Rural residents also have: Higher injury rates (NCHS, 2017). Higher smoking rates (NCHS, 2017). Higher rates of uninsurance (NCHS, 2017). Higher rates of suicide (Kegler, et al., 2017). Higher rates of opioid misuse (Warshaw, 2017). More residents of nonmetropolitan areas live in poverty compared with residents of metropolitan areas. A higher percentage of residents in rural areas has activity limitations due to chronic health conditions. Nonmetropolitan areas have higher rates of cigarette smoking, hypertension, obesity, and physical inactivity during leisure time. One study found that 9 of 10 counties with highest smoking prevalence for males were nonmetropolitan counties and the counties with the top 10 highest prevalence of female smokers were all nonmetropolitan counties (Dwyer- Lindgren, et al., 2014). 4 | National Healthcare Quality and Disparities Report Rural Health Life Expectancy in Rural Areas Life expectancy for residents decreases as level of rurality increases: In 2005-2009, those living in large metropolitan areas had a life expectancy of years compared with years for those living in rural areas.
10 This disparity widened over time. Causes of death contributing most to lower life expectancy in rural areas include: Heart disease, Unintentional injuries, Chronic obstructive pulmonary disease, Lung cancer, Stroke, Suicide, and Diabetes (Singh & Siahpush, 2014). During 1999-2014, annual age-adjusted death rates for heart disease, stroke, cancer, unintentional injury, and chronic lower respiratory disease (CLRD) were higher in nonmetropolitan areas than metropolitan areas. Age-adjusted death rates for unintentional injury were approximately 50% higher in nonmetropolitan areas than in metropolitan areas. Rates for heart disease and death rates for cancer decreased at a slower rate in nonmetropolitan areas compared with metropolitan areas. CLRD decreased in metropolitan areas but increased in nonmetropolitan areas (Moy, et al., 2017). Life Expectancy in Counties Life Life Expectancy Expectancy Across Across Counties Counties Life LifeExpectancy Expectancyat at Birth Birthby by County, County, 2014.