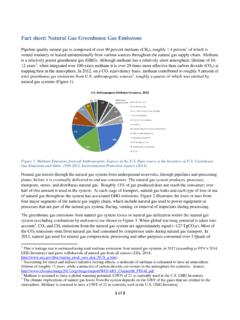
Transcription of Natural gas – Statistical Review of World Energy 2021
1 Natural gas 34 Reserves 36 Production 38 Consumption 41 Prices 42 Trade movements Statistical Review of World Energy 2021 | 70th edition Natural gas Total proved reserves At end 2000 At end 2010 At end 2019 At end 2020. Trillion Trillion Trillion Trillion Trillion cubic cubic cubic cubic cubic Share of R/P. metres metres metres metres feet total ratio Canada Mexico US Total North America Argentina Bolivia Brazil Colombia . Peru Trinidad & Tobago Venezuela Other S. & Cent. America . Total S. & Cent. America Denmark . Germany . Italy . Netherlands Norway Poland . Romania . Ukraine United Kingdom Other Europe . Total Europe Azerbaijan Kazakhstan Russian Federation Turkmenistan Uzbekistan Other CIS . Total CIS Bahrain . Iran Iraq Israel Kuwait Oman Qatar Saudi Arabia Syria United Arab Emirates Yemen Other Middle East.
2 Total Middle East Algeria Egypt Libya Nigeria Other Africa Total Africa Australia Bangladesh Brunei China India Indonesia Malaysia Myanmar Pakistan Papua New Guinea Thailand Vietnam Other Asia Pacific Total Asia Pacific Total World of which: OECD Non-OECD European Union Source of data the estimates in this table have been compiled using a combination of primary official sources and third-party data from Cedigaz and the OPEC Secretariat. As far as possible, the data above represents standard cubic metres (measured at 15 C and 1013 mbar) and have been standardized using a gross calorific value (GCV) of 40 MJ/m3. Less than Less than Notes: Total proved reserves of Natural gas generally taken to be those quantities that geological and engineering information indicates with reasonable certainty can be recovered in the future from known reservoirs under existing economic and operating conditions.
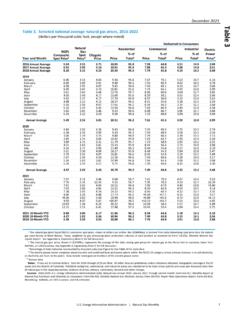
3 The data series for total proved Natural gas does not necessarily meet the definitions, guidelines and practices used for determining proved reserves at a company level, for instance as published by the US Securities and Exchange Commission, nor does it necessarily represent bp's view of proved reserves by country. Reserves-to-production (R/P) ratio if the reserves remaining at the end of any year are divided by the production in that year, the result is the length of time that those remaining reserves would last if production were to continue at that rate. 34 bp Statistical Review of World Energy 2021. Reserves-to-production (R/P) ratios Years 2020 by region History 120 600. North America Africa S. & Cent. America Middle East Europe Asia Pacific CIS World 100 500. 80 400. 60 300. 40 200. 20 100. North S.
4 & Cent. Europe CIS Middle Africa Asia 0 90 95 00 05 10 15 20 0. America America East Pacific World proved gas reserves decreased by Tcm to Tcm in 2020. A revision to Algeria ( Tcm) provided the largest decrease, partially offset by a Tcm increase in Canadian reserves. Russia (37 Tcm), Iran (32 Tcm) and Qatar (25 Tcm) are the countries with the largest reserves. The current global R/P ratio shows that gas reserves in 2020 accounted for years of current production. The Middle East ( years) and CIS ( years) are the regions with the highest R/P ratio. Distribution of proved reserves in 2000, 2010 and 2020. Percentage Middle East CIS. Asia Pacific North America Africa S. & Cent. America Europe 2020. Total trillion cubic 2010 metres Total trillion cubic 2000 metres Total trillion cubic metres bp Statistical Review of World Energy 2021 35.
5 Natural gas: Production in billion cubic metres*. Growth rate per annum Share Billion cubic metres 2010 2011 2012 2013 2014 2015 2016 2017 2018 2019 2020 2020 2009-19 2020. Canada Mexico US Total North America Argentina Bolivia Brazil Colombia Peru Trinidad & Tobago Venezuela Other S. & Cent. America Total S. & Cent. America Denmark . Germany Italy Netherlands Norway Poland Romania Ukraine United Kingdom Other Europe Total Europe Azerbaijan Kazakhstan Russian Federation Turkmenistan Uzbekistan Other CIS . Total CIS Bahrain Iran Iraq Kuwait Oman Qatar Saudi Arabia Syria United Arab Emirates Yemen . Other Middle East Total Middle East Algeria Egypt Libya Nigeria . Other Africa Total Africa Australia Bangladesh Brunei China India Indonesia Malaysia Myanmar Pakistan Thailand Vietnam Other Asia Pacific Total Asia Pacific Total World of which: OECD Non-OECD European Union * E xcludes gas flared or recycled.
6 Includes Natural gas produced for gas-to-liquids transformation. Source: includes data from Cedigaz, FGE MENAgas service. Less than n/a not available. Notes: As far as possible, the data above represents standard cubic metres (measured at 15 C and 1013 mbar); as they are derived directly from measures of Energy content using an average conversion factor and have been standardized using a gross calorific value (GCV) of 40 MJ/m3, they do not necessarily equate with gas volumes expressed in specific national terms. Annual changes and shares of total are calculated using billion cubic metres figures. Natural gas production data expressed in billion cubic feet per day is available at 36 bp Statistical Review of World Energy 2021. Natural gas: Production in exajoules*. Growth rate per annum Share Exajoules 2010 2011 2012 2013 2014 2015 2016 2017 2018 2019 2020 2020 2009-19 2020.
7 Canada Mexico US Total North America Argentina Bolivia Brazil Colombia Peru Trinidad & Tobago Venezuela Other S. & Cent. America Total S. & Cent. America Denmark . Germany Italy Netherlands Norway Poland Romania Ukraine United Kingdom Other Europe Total Europe Azerbaijan Kazakhstan Russian Federation Turkmenistan Uzbekistan Other CIS . Total CIS Bahrain Iran Iraq Kuwait Oman Qatar Saudi Arabia Syria United Arab Emirates Yemen . Other Middle East Total Middle East Algeria Egypt Libya Nigeria . Other Africa Total Africa Australia Bangladesh Brunei China India Indonesia Malaysia Myanmar Pakistan Thailand Vietnam Other Asia Pacific Total Asia Pacific Total World of which: OECD Non-OECD European Union *Excludes gas flared or recycled. Includes Natural gas produced for gas-to-liquids transformation. Source: includes data from Cedigaz, FGE MENAgas service.
8 Less than n/a not available. Note: Annual changes and shares of total are calculated using exajoules figures. bp Statistical Review of World Energy 2021 37. Natural gas: Consumption in billion cubic metres*. Growth rate per annum Share Billion cubic metres 2010 2011 2012 2013 2014 2015 2016 2017 2018 2019 2020 2020 2009-19 2020. Canada Mexico US Total North America Argentina Brazil Chile Colombia Ecuador . Peru Trinidad & Tobago Venezuela Other S. & Cent. America Total S. & Cent. America Austria Belgium Czech Republic Finland France Germany Greece Hungary Italy Netherlands Norway Poland Portugal Romania Spain Sweden . Switzerland Turkey Ukraine United Kingdom Other Europe Total Europe Azerbaijan Belarus Kazakhstan Russian Federation Turkmenistan Uzbekistan Other CIS Total CIS Iran Iraq Israel Kuwait Oman Qatar Saudi Arabia United Arab Emirates Other Middle East Total Middle East Algeria Egypt Morocco.
9 South Africa Other Africa Total Africa Australia Bangladesh China China Hong Kong SAR India Indonesia Japan Malaysia New Zealand Pakistan Philippines Singapore South Korea Sri Lanka n/a n/a n/a Taiwan Thailand Vietnam Other Asia Pacific Total Asia Pacific Total World of which: OECD Non-OECD European Union Source: includes data from Cedigaz, FGE MENAgas service. *Excludes Natural gas converted to liquid fuels but includes derivatives of coal as well as Natural gas consumed in gas-to-liquids transformation. Less than n/a not available. Notes: As far as possible, the data above represents standard cubic metres (measured at 15 C and 1013 mbar); as they are derived directly from measures of Energy content using an average conversion factor and have been standardized using a gross calorific value (GCV) of 40 MJ/m3, they do not necessarily equate with gas volumes expressed in specific national terms.
10 The difference between these World consumption figures and the World production statistics is due to variations in stocks at storage facilities and liquefaction plants, together with unavoidable disparities in the definition, measurement or conversion of gas supply and demand data. Annual changes and shares of total are calculated using billion cubic metres figures. Growth rates are adjusted for leap years. Natural gas consumption data expressed in billion cubic feet per day is available at 38 bp Statistical Review of World Energy 2021. Natural gas: Consumption in exajoules*. Growth rate per annum Share Exajoules 2010 2011 2012 2013 2014 2015 2016 2017 2018 2019 2020 2020 2009-19 2020. Canada Mexico US Total North America Argentina Brazil Chile Colombia Ecuador . Peru Trinidad & Tobago Venezuela Other S.