Transcription of NBB with Quasi-Banking Functions (NBQBs)
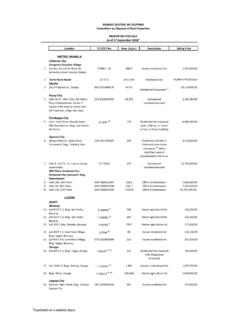
1 19 NBQBsNon-Bank Financial Institutions with Quasi-Banking Functions ( nbqbs )OverviewNon-bank financial institutions(NBFIs) are financial institutions supervised by BSP. These do not have a full banking license but they facilitate bank-related financial services, , investment, risk pooling, contractual savings and market brokering. In the Philippines, NBFIs are composed of the non-banks with Quasi-Banking Functions and non-banks without Quasi-Banking with Quasi-Banking Functions ( nbqbs ) consist of financial institutions engaged in the borrowing of funds from 20 or more lenders for the borrower s own account through issuances, endorsement or assignment with recourse or acceptance of deposit substitutes for purposes of re-lending or purchasing receivables and other of end-June 2013, total resources of nbqbs accounted for percent ( billion) of the total assets of non-bank financial institutions (NBFIs) supervised by the BSP, total of which composed percent ( billion) of the Philippine Financial System s total resources (P9, billion).
2 This is a higher proportion compared to same period last year s percent ( billion) which then represented percent ( billion) of the Philippine Financial System s total resources (P7, billion). During the review period, there were 13 operating nbqbs in the country [six investment houses (IHs), six financing companies (FCs) and one other non-bank]. The number of nbqbs declined from last semester s 14 operating nbqbs due to the approval by the Monetary Board of the request for revocation of Quasi-Banking license of an IH, , BPI Leasing Corporation on 08 January 201315. Of the 13 operating nbqbs , seven are linked to universal and commercial banks (two IHs and five FCs). The number of operating nbqbs is percent of the total 6,319 NBFIs supervised/regulated by the BSP. nbqbs total office network stood at 76 (13 head offices and 63 branches/other offices).
3 nbqbs post record high bottom line figures The year-on-year growth in net profit surpassed the percent growth in average assets and the percent expansion in average equity. The NBQB industry posted a net profit of billion in end-June 2013, which accounted for percent of the total net profit of NBFIs. This is more than twice the profit recorded at end-June 2012 of billion. FCs with QB accounted for percent of net profit while IHs with QB accounted for percent. Operating income improved by percent to billion from year ago s billion. This is due to the surge in the non-interest income particularly of trading gains as it more than tripled to billion in end-June 2013 from billion in end-June 2012. Net interest income also rose by percent to billion while non-interest income soared by percent to billion as the economy picked up particularly driven by construction, real estate, services catering to outsourcing and insourcing, tourism and expenses increased by percent to billion from billion same period last year.
4 Accordingly, cost-to-income ratio slightly rose to percent from the percent at end-December 2012 but better than the percent recorded at end-June 2012 (Figure 36). Percent (RHS)In PBillion (LHS)Figure36 Non-BankFinancial Institutions with Quasi-Banking Functions ( nbqbs )Cost-to-Income 2013*Operating Income (LHS)Operating Expense (net of bad debts and provisions) (LHS)Operating Expense (net of bad debts and provisions) (LHS)Cost-to-Income (RHS)_____15 Circular Letter (CL) 2013-003 dated 08 January Report on the Philippine Financial SystemLikewise, nbqbs provided better return on assets (ROA) at percent, up percent at end-June 2012 and return on equity (ROE) at percent, up from percent. Resources channeled mostly to loans and investments Total assets of nbqbs stood at billion, higher by percent from year ago s billion (Table 43).
5 IHs with QB held a slightly bigger share of NBQB total assets with a percent share ( billion), up from last year s percent share ( billion). Meanwhile, FCs with QB pitched in the remaining percent share ( billion), down from year ago s percent share (but up from billion).NBQB assets were mainly channeled to loans, net, and investments, net, with a combined share of percent of total assets, down from year ago s percent share (Figure 37). Loans, net, garnered percent share ( billion), down from year ago s percent ( billion). Investments, net, on the other hand, occupied a percent share ( billion), up from last year s percent share ( billion).Manageable loan and asset qualityNBQB loan and asset quality remained manageable for the first half of 2013. nbqbs non-performing loans (NPL) ratio of percent slightly grew from year ago s percent, which resulted from the slight percent growth in NPLs to billion from same time last year s billion.
6 By subgroup, IHs with QB posted better NPL ratio at percent, as against FCs with QB NPL ratio of percent. Meanwhile, NPL coverage ratio dropped to percent from year ago s percent which was caused by the percent growth in NPLs surpassing the percent rise in and Due from Banks, Investments, net, and Due from Banks, Investments, net, 37 Non-BankFinancial Institutions with Quasi-Banking Functions ( nbqbs )Asset and Funding MixLoans, net, Assets, , net, billionLoans, net, Assets, , net, NPLs and NPL COVERAGE RATIO NPAs and NPA COVERAGE RATIO DISTRESSED ASSETS RATIOF igure 38 Non-Bank Financial Institutions with Quasi-Banking Functions ( nbqbs ) In PercentIn P BillionNPLs (LHS)LLRs (LHS)NPL Ratio (RHS)NPL Coverage Ratio (RHS) In PercentIn P BillionNPAs (LHS)NPA Reserves (LHS)NPA Ratio (RHS)NPA Coverage Ratio (RHS)
7 In PercentIn P BillionNPAs (LHS)RLs, Performing (LHS)Distressed Assets Ratio (RHS)21 NBQBsAs of end-June 2013, nbqbs real and other properties acquired (ROPA) slightly dropped by percent to billion from same period last year s billion. As a result, ROPA-to-gross assets ratio also went down to percent from same period last year s percent. By subgroup, FCs with QB posted better ROPA-to-gross assets ratio at percent as against to percent of IHs with QB. ROPA reserves went down to billion from same time last year s billion resulting to a lower ROPA coverage ratio at percent from year ago s non-performing assets (NPA) ratio of percent fell from year ago s percent. By subgroup, IHs with QB posted better NPA ratio at percent, compared to FCs with QB NPL ratio of percent. NPA coverage ratio was enhanced to percent from year ago s percent.
8 This is due to the percent decline in the NPAs caused by percent drop in ROPA surpassing the decline in NPA of the end-June 2013, nbqbs distressed assets went down to billion from billion at end-June 2012 resulting to a distressed assets ratio of percent, same as year ago. By subgroup, FCs with QB posted better distressed assets ratio at percent, as compared to IHs with QB of percent (Figure 38).Ample liquidity, stable funding and adequate capitalizationThe NBQB industry maintained ample liquidity as liquid assets-to-bills payable ratio expanded to percent from year ago s percent. Meanwhile, gross loans-to-bills payable ratio dropped to percent from year ago s percent (Table 44). Most of the FCs and IHs with QB are also linked to universal and commercial banks which can cushion the NBQB industry whenever liquidity problems industry s total liabilities stood at billion, up by percent ( billion) from year ago s billion.
9 Bills payable, which comprise the bulk ( percent) of total liabilities, rose by percent year-on-year. Other liabilities which formed the remaining percent of total liabilities also grew by percent (Figure 39).The industry s total capital accounts posted a robust growth of percent ( billion) to reach billion from year ago s billion. This was influenced by the growth in retained earnings and undivided profits by percent to billion from year ago s billion. Meantime, capital stock fell by percent to billion from year ago s billion. This is due to the decline in the number of operating nbqbs to 13 from 15 a year ago. By sub-group, IHs with QB s retained earnings beefed up by percent surpassing the percent decline in FCs with QB s retained earnings. On the other hand, the capital stock of both FCs and IHs with QB fell by percent and percent, respectively.
10 The industry continued to be well capitalized during the review period. Total capital accounts-to-total assets ratio for nbqbs increased to percent from year ago s Accounts, billionCapital Accounts, 39 Non-Bank Financial Institutions with Quasi-Banking (NBQBs) FundingMixBills Payable, Liabilities, Payable, Liabilities, Report on the Philippine Financial SystemOverviewNon-stock savings and loan associations (NSSLAs)16 are non-stock, non-profit corporations engaged in the business of accumulating member s savings for lending to households by providing long-term financing for home building and/or development and for personal of end-June 2013, total resources of NSSLAs comprised percent ( billion) of the total resources of the BSP-supervised NBFIs, which constituted percent ( billion)