Transcription of New Energy Outlook 2020
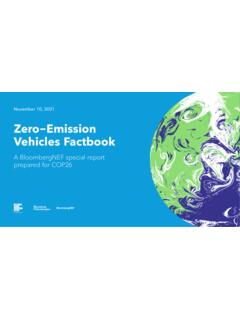
1 New Energy Outlook2020 October 2020#BNEFNEOE xecutive Summary2 October 2020#BNEFNEO3 New Energy Outlook 2020 / PreambleNo portion of this document may be reproduced, scanned into an electronic system, distributed, publicly displayed or used as the basis of derivative works without the prior written consent of Bloomberg Finance For more information on terms of use, please contact Copyright and Disclaimer notice on page 245 applies throughout. Bloomberg Finance 2019 Welcome to the 2020 New Energy OutlookThe New Energy Outlook 2020 has three major components: 1. The Economic Transition Scenario (ETS) is our core economics-led scenario that employs a combination of near-term market analysis, least-cost modeling, consumer uptake and trend-based analysis to describe the deployment and diffusion of commercially available technologies. Over the long-term we remove policy drivers to uncover the underlying economic fundamentals of the Energy transition. As such, this scenario does not bake in climate targets, nor does it mandate aspirational national Energy policies 2.
2 Our NEO Climate Scenario (NCS) investigates pathways to reduce greenhouse gas emissions to meet a well-below-two-degree emissions budget. This year we have focused on a clean electricity and green-hydrogen pathway. In future analysis we will look at other pathways to deep The final section is called Implications for Policy. This offers the BNEF perspective on some of the most important policy areas that emerge from our ETS and NCS New Energy Outlook (NEO) is BloombergNEF s annual long-term scenario analysis on the future of the Energy economy. This year we have gone beyond our traditional focus on the electricity sector, to include detailed chapters on industry , buildings and transport and offer a full-coverage assessment of the Energy economy and its drivers to 2050. We hope this will make NEO an even more valuable input to support strategy development and long-term of the things that sets NEO apart is its focus on technology. This includes proprietary project data, market-price surveys and detailed, bottom-up, component-by-component project-cost modeling.
3 Another is coverage of consumer uptake for electric vehicles, small-scale PV, batteries and heat pumps, and in particular how falling costs and growing market penetration creates imitation effects that can drive exponential growth. The study leverages the Bloomberg Terminal for commodity prices, asset data, industry fundamentals, financing rates, macroeconomic forecasts and trade-flow information. And finally, NEO is built by more than 65 analysts from 12 countries who help construct a bottom-up, sector-by-sector and country-by-country analysis from which our global conclusions emerge. Seb Henbest Chief Economist, BloombergNEFJon Moore CEO, BloombergNEF4No portion of this document may be reproduced, scanned into an electronic system, distributed, publicly displayed or used as the basis of derivative works without the prior written consent of Bloomberg Finance For more information on terms of use, please contact Copyright and Disclaimer notice on page 245 applies throughout.
4 Bloomberg Finance 2019 About BloombergNEFB loombergNEF (BNEF), Bloomberg s primary research service, covers clean Energy , advanced transport, digital industry , innovative materials and commodities. We help corporate strategy, finance and policy professionals navigate change and generate online, on mobile and on the Terminal, BNEF is powered by Bloomberg s global network of 19,000 employees in 176 locations, reporting 5,000 news stories a out +1 212 617 4050 EMEA +44 20 3216 4704 Asia Pacific +81 3 3201 3112 @BloombergNEFBNEF <GO>5No portion of this document may be reproduced, scanned into an electronic system, distributed, publicly displayed or used as the basis of derivative works without the prior written consent of Bloomberg Finance For more information on terms of use, please contact Copyright and Disclaimer notice on page 245 applies throughout. Bloomberg Finance 2019 Economic Transition Scenario / Energy & EmissionsEnergy & Emissions EnergyEnergy - 1.
5 Total final Energy use in our Economic Transition Scenario rises 24% from 419EJ in 2019 to 516EJ in 2050. This is around year-on-year. The Covid-19 pandemic pushes final Energy demand down 5% in 2020, before demand returns to pre-crisis levels in - 2. Building Energy grows most in our Economic Transition Scenario, up 42% to 2050. Roughly 58% of the growth in absolute terms comes from the residential sector, although demand from commercial buildings grows faster. Final Energy use is up 22% in industry , with growth in all Energy -intensive sectors. Steel sees the least increase, thanks to a 45% jump in recycling, which has one-fifththe Energy intensity of - 3. Final Energy in transport sees the most change. It peaks in 2035 and then falls year on year to 2050, when it is just 5% above 2019 levels. This is due to the road sector, where demand is eroded by the combination of more Energy efficient electric vehicles, tighter fuel-economy standards for internal combustion engine vehicles and, crucially, a slowdown and decline in new global new car sales driven by demographic shifts, urbanization, and shared mobility.
6 Final Energy for aviation is up 95% and rail rises 33%. Shipping slips 2% from a peak in 2037 as a result of slowing growth in global cargo-ton miles, and a gradual increase in fleet fuel efficiency. Source: BloombergNEF2019020,00040,00060,00080,00 0100,000120,000140,000160,000180,0002000 20102020203020402050 SteelAluminumCementPetrochemicalsOther industryResidentialCommercialRoadShippin gAviationRailOtherNon- Energy usePowerEnergy - 4. Fossil fuels drop from 67% of total final Energy in 2019, to 61% in 2050. The use of oil products declines by 3%, from 41% of final Energy in 2019, to 32% in 2050. Electricity use is up 50% over the Outlook , accounting for 24% of final Energy in 2050, up from 20% in 2019. Part of this is the shift to electric vehicles, which pushes up electricity use in road transport by a factor of 45 from 2019 levels. More significant in absolute terms, however, is the 60% growth in electricity use in buildings, which expands with population and - 5.
7 Primary Energy grows 9% to 679EJ in 2050, from 623EJ in 2019. Fossil fuels grow less than 1% over the period in absolute terms, however, their share of the primary Energy mix falls from 80% to 70%. In contrast, renewable Energy increases by a factor of more than four to make up 14% of primary Energy , compared with 4% today. Nuclear and bioenergy and zero-emissions sources together account for 27% of the primary Energy supply in 2050, from 17% today. Energy - 6. Primary oil demand peaks in 2035 at 211EJ as growth in petrochemicals and aviation is offset by decline in road transport and better machine efficiency. From there it drops year on year to return to 2018 levels, at 189EJ, in 2050. At this time it makes up 28% of primary Energy . Figure 1: Primary coal demand, by end-use sector PJ6No portion of this document may be reproduced, scanned into an electronic system, distributed, publicly displayed or used as the basis of derivative works without the prior written consent of Bloomberg Finance For more information on terms of use, please contact Copyright and Disclaimer notice on page 245 applies throughout.
8 Bloomberg Finance 2019 Energy - coal demand appears to have peaked back in 2018. This coincides with the peak in coal-fired power generation, as demand for thermal coal, hit hard by the Covid-19 pandemic, struggles to return to pre-crisis levels. In 2050, coal is down 24% from 2019 levels and makes up just 18% of primary - demand grows year on year throughout our Economic Transition Scenario. Decline in the power sector is met with ongoing growth in buildings and industry , where there is a lack of cost-competitive low-carbon alternatives. In 2050, gas demand is up 15% but it still makes up just 24% of primary Energy . Energy - present, around 28% of primary Energy is lost in its transformation to final Energy . The majority of this is in the power sector, where most coal and gas-fired generators are between 35% and 47% efficient. Losses decrease over time from 33% in 2019 to 24% in 2050 as a result of renewables growth. Similarly, losses in final Energy are around 33% in 2019.
9 The vast majority of these come from the transport sector, from the use of diesel and gasoline in conventional internal combustion engine vehicles that are between 12% and 40% efficient. Energy - together, around 55% of primary Energy is wasted either in the production of electricity, refined fuels, or in end-use machines. The vast majority of these losses come from the use of coal, gas and oil. The difference between final and useful Energy shows how end-use electrification reduces Energy demand for the same output. In other words, we can do the same with less. In addition, using more renewable Energy reduces the Energy throughput between primary and final Energy . Energy - at primary Energy can also mask rapid changes downstream, where growth is occurring from a low base. For example, renewables made up just 4% of primary Energy in 2019, far smaller than oil, which was at 32%. With downstream losses taken into account, we see a more balanced picture, with wind and PV together growing to 19% of useful Energy in 2050 in our Economic Transition Scenario, compared to oil, at 25% and gas, at 22%.
10 Source: BloombergNEF2019050,000100,000150,000200 ,000250,000300,000350,000400,00020002010 2020203020402050 PJCoalGasOilBioenergyElectricityOtherFig ure 2: Total useful Energy , by source7No portion of this document may be reproduced, scanned into an electronic system, distributed, publicly displayed or used as the basis of derivative works without the prior written consent of Bloomberg Finance For more information on terms of use, please contact Copyright and Disclaimer notice on page 245 applies throughout. Bloomberg Finance 2019 Economic Transition Scenario / Energy & EmissionsEmissionsEmissions - from fuel combustion in power, transport, industry and buildings peak in 2019 at in our Economic Transition Scenario, as the Energy transition in the power sector offsets growth in the end-use sectors. Energy emissions drop in 2020 as a result of the Covid-19 pandemic and then rise again to a lower peak in 2027. Emissions then fall at around per year to in 2050, which is 16% below 2019 levels.