Transcription of News Release
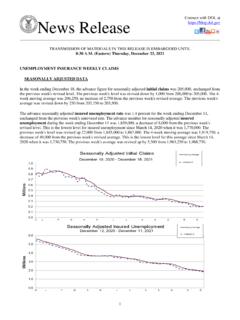
1 1 News Release Connect with DOL at TRANSMISSION OF MATERIALS IN THIS Release IS EMBARGOED UNTIL 8:30 (Eastern) Thursday, December 2, 2021 unemployment INSURANCE WEEKLY CLAIMS SEASONALLY ADJUSTED DATA In the week ending November 27, the advance figure for seasonally adjusted initial claims was 222,000, an increase of 28,000 from the previous week's revised level. The previous week's level was revised down by 5,000 from 199,000 to 194,000. The 4-week moving average was 238,750, a decrease of 12,250 from the previous week's revised average. This is the lowest level for this average since March 14, 2020 when it was 225,500. The previous week's average was revised down by 1,250 from 252,250 to 251,000. The advance seasonally adjusted insured unemployment rate was percent for the week ending November 20, a decrease of percentage point from the previous week's unrevised rate.
2 The advance number for seasonally adjusted insured unemployment during the week ending November 20 was 1,956,000, a decrease of 107,000 from the previous week's revised level. This is the lowest level for insured unemployment since March 14, 2020 when it was 1,770,000. The previous week's level was revised up 14,000 from 2,049,000 to 2,063,000. The 4-week moving average was 2,084,250, a decrease of 36,250 from the previous week's revised average. This is the lowest level for this average since March 21, 2020 when it was 2,071,750. The previous week's average was revised up by 3,500 from 2,117,000 to 2,120,500. 2 UNADJUSTED DATA The advance number of actual initial claims under state programs, unadjusted, totaled 211,896 in the week ending November 27, a decrease of 41,622 (or percent) from the previous week. The seasonal factors had expected a decrease of 69,304 (or percent) from the previous week.
3 There were 711,416 initial claims in the comparable week in 2020. In addition, for the week ending November 27, 31 states reported 1,406 initial claims for Pandemic unemployment Assistance. The advance unadjusted insured unemployment rate was percent during the week ending November 20, a decrease of percentage point from the prior week. The advance unadjusted level of insured unemployment in state programs totaled 1,563,000, a decrease of 265,775 (or percent) from the preceding week. The seasonal factors had expected a decrease of 157,942 (or percent) from the previous week. A year earlier the rate was percent and the volume was 5,233,689. The total number of continued weeks claimed for benefits in all programs for the week ending November 13 was 2,306,353, an increase of 21,564 from the previous week. There were 20,756,040 weekly claims filed for benefits in all programs in the comparable week in 2020.
4 During the week ending November 13, Extended Benefits were available in the following 4 states: Alaska, Connecticut, New Jersey, and New Mexico Initial claims for UI benefits filed by former Federal civilian employees totaled 947 in the week ending November 20, a decrease of 63 from the prior week. There were 392 initial claims filed by newly discharged veterans, a decrease of 1 from the preceding week. 3 There were 8,495 continued weeks claimed filed by former Federal civilian employees the week ending November 13, an increase of 641 from the previous week. Newly discharged veterans claiming benefits totaled 5,101, an increase of 264 from the prior week. During the week ending November 13, 42 states reported 170,300 continued weekly claims for Pandemic unemployment Assistance benefits and 42 states reported 146,449 continued claims for Pandemic Emergency unemployment Compensation benefits.
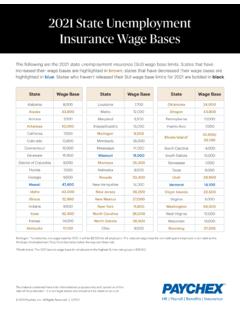
5 The highest insured unemployment rates in the week ending November 13 were in Puerto Rico ( ), District of Columbia ( ), the Virgin Islands ( ), Alaska ( ), California ( ), New Jersey ( ), Hawaii ( ), Illinois ( ), Nevada ( ), and Pennsylvania ( ). The largest increases in initial claims for the week ending November 20 were in Virginia (+12,703), New Jersey (+2,061), Michigan (+1,926), Oklahoma (+1,490), and Minnesota (+1,465), while the largest decreases were in California (-7,233), Kentucky (-3,910), District of Columbia (-1,679), Missouri (-1,519), and Massachusetts (-1,410). 4 unemployment INSURANCE DATA FOR REGULAR STATE PROGRAMS WEEK ENDING November 27 November 20 Change November 13 Prior Year1 Initial Claims (SA) 222,000 194,000 +28,000 270,000 719,000 Initial Claims (NSA) 211,896 253,518 -41,622 240,435 711,416 4-Wk Moving Average (SA) 238,750 251,000 -12,250 273,250 735,250 WEEK ENDING November 20 November 13 Change November 6 Prior Year1 Insured unemployment (SA) 1,956,000 2,063,000 -107,000 2,109,000 5,606,000 Insured unemployment (NSA) 1,563,000 1,828,775 -265,775 1,783,320 5,233,689 4-Wk Moving Average (SA) 2,084,250 2,120,500 -36,250 2,164,500 6,214,250 Insured unemployment Rate (SA)2 Insured unemployment Rate (NSA)2 INITIAL CLAIMS FILED IN FEDERAL PROGRAMS (UNADJUSTED)
6 WEEK ENDING November 27 November 20 Change November 13 Prior Year1 Pandemic unemployment Assistance 1,406 1,616 -210 1,380 280,997 WEEK ENDING November 20 November 13 Change Prior Year1 Federal Employees (UCFE) 947 1,010 -63 2,806 Newly Discharged Veterans (UCX) 392 393 -1 823 CONTINUED WEEKS CLAIMED FILED FOR UI BENEFITS IN ALL PROGRAMS (UNADJUSTED) WEEK ENDING November 13 November 6 Change Prior Year1 Regular State 1,823,817 1,778,063 +45,754 5,876,710 Federal Employees 8,495 7,854 +641 14,494 Newly Discharged Veterans 5,101 4,837 +264 11,154 Pandemic unemployment Assistance3 170,300 187,243 -16,943 9,142,751 Pandemic Emergency UC4 146,449 151,556 -5,107 4,901,839 Extended Benefits5 131,428 134,116 -2,688 681,078 State Additional Benefits6 2,855 2,985 -130 2,625 STC / Workshare 7 17,908 18,135 -227 125,389 TOTAL8 2,306,353 2,284,789 +21,564 20,756,040 FOOTNOTES SA - Seasonally Adjusted Data, NSA - Not Seasonally Adjusted Data Continued weeks claimed represent all weeks of benefits claimed during the week being reported, and do not represent weeks claimed by unique individuals.
7 1. Prior year is comparable to most recent data. 2. Most recent week used covered employment of 135,015,266 as denominator. 3. Information on the Pandemic unemployment Assistance (PUA) program can be found in UIPL 16-20: PUA Program information 4. Information on the Pandemic Emergency unemployment Compensation (PEUC) program can be found in unemployment Insurance Program Letter (UIPL) 17-20: PEUC Program information 5. Information on the EB program can be found here: EB Program information 6. Some states maintain additional benefit programs for those claimants who exhaust regular benefits, and when applicable, extended benefits. Information on states that participate, and the extent of benefits paid, can be found starting on page 4-4 of this link: Extensions and Special Programs PDF 7. Information on STC/Worksharing can be found starting on page 9-10 of the following link: Extensions and Special Programs PDF 8.
8 Totals include PUA unemployment for the appropriate corresponding week. 5 Advance State Claims - Not Seasonally Adjusted Initial Claims Filed During Week Ended November 27 Insured unemployment For Week Ended November 20 STATE Advance Prior Wk Change Advance Prior Wk Change Alabama 2,047 3,904 -1,857 4,086 5,885 -1,799 Alaska 1,389 1,451 -62 7,861 7,782 79 Arizona 1,844 2,757 -913 12,479 16,730 -4,251 Arkansas 1,453 1,408 45 8,192 10,885 -2,693 California 47,922 52,490 -4,568 343,392 433,140 -89,748 Colorado 1,641 2,083 -442 19,343 20,365 -1,022 Connecticut 2,977 2,706 271 22,185 22,469 -284 Delaware 461 357 104 3,872 4,084 -212 District of Columbia 634 1,400 -766 13,976 17,966 -3,990 Florida 3,808 5,831 -2,023 38,695 50,579 -11,884 Georgia 2,337 4,249 -1,912 25,237 33,596 -8,359 Hawaii 1,213 1,544 -331 9,061 11,242 -2,181 Idaho 1,538 1,329 209 3,611 3.
9 701 -90 Illinois 10,958 10,606 352 91,444 122,461 -31,017 Indiana 3,382 3,566 -184 23,083 26,895 -3,812 Iowa 1,898 2,853 -955 9,209 9,513 -304 Kansas 750 970 -220 4,424 5,183 -759 Kentucky 1,279 1,349 -70 8,247 13,629 -5,382 Louisiana 1,358 2,001 -643 17,648 20,293 -2,645 Maine 815 936 -121 4,781 4,888 -107 Maryland 2,000 2,259 -259 21,168 25,431 -4,263 Massachusetts 6,642 7,388 -746 53,671 56,373 -2,702 Michigan 8,915 11,654 -2,739 36,538 47,991 -11,453 Minnesota 7,429 8,166 -737 51,823 47,695 4,128 Mississippi 943 1,166 -223 4,518 5,868 -1,350 Missouri 2,626 3,108 -482 12,966 16,795 -3,829 Montana 1,545 1,408 137 4,989 4,804 185 Nebraska 695 868 -173 3,101 3,424 -323 Nevada 2,021 2,296 -275 20,948 23,620 -2,672 New Hampshire 363 466 -103 2,278 2,414 -136 New Jersey 6,537 8,994 -2,457 83,194 87,869 -4,675 New Mexico 1,580 1,705 -125 10,614 11,331 -717 New York 13,115 14,964 -1,849 139,781 144,464 -4,683 North Carolina 8,116 5,722 2,394 19,805 22,570 -2,765 North Dakota 791 703 88 2,111 1,646 465 Ohio 7,494 7,223 271 30,859 38,942 -8,083 Oklahoma 1,249 3,318 -2,069 12,108 14,646 -2,538 Oregon 3,540 4,419 -879 30,167 32,463 -2,296 Pennsylvania 9,956 10,688 -732 82,009 107,952 -25,943 Puerto Rico 573 915 -342 17,631 29,620 -11,989 Rhode Island 749 753 -4 7,070 7,319 -249 South Carolina 776 1,263 -487 10,750 13,154 -2,404 South Dakota 218 304 -86 873 1,009 -136 Tennessee 3,967 4,179 -212 17,012 20,367 -3,355 Texas 9,919 15,910 -5,991 108,303 118,513 -10,210 Utah 1,058 1,397 -339 5,913 5,988 -75 Vermont 699 539 160 2,281 2.
10 502 -221 Virgin Islands 32 54 -22 554 1,148 -594 Virginia * 3,966 13,094 -9,128 19,301 7,312 11,989 Washington 5,125 5,830 -705 43,731 48,514 -4,783 West Virginia 580 921 -341 6,792 6,617 175 Wisconsin 8,576 7,468 1,108 27,163 27,362 -199 Wyoming 397 586 -189 2,152 1,766 386 US Total 211,896 253,518 -41,622 1,563,000 1,828,775 -265,775 Note: Advance claims are not directly comparable to claims reported in prior weeks. Advance claims are reported by the state liable for paying the unemployment compensation, whereas previous weeks reported claims reflect claimants by state of residence. In addition, claims reported as "workshare equivalent" in the previous week are added to the advance claims as a proxy for the current week's "workshare equivalent" activity. *Denotes OUI estimate. 6 Seasonally Adjusted US Weekly UI Claims (in thousands)