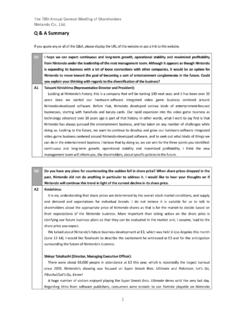
Transcription of Nintendo Co., Ltd.
1 Nintendo Co., Releasefor Fiscal Year Ended March 2018 Supplementary Information[Note]Forecasts announced by Nintendo Co., Ltd. herein are prepared based onmanagement's assumptions with information available at this time andtherefore involve known and unknown risks and uncertainties. Please notesuch risks and uncertainties may cause the actual results tobe materiallydifferent from the forecasts (earnings forecast, dividendforecast and otherforecasts). Nintendo Co., Statements of Income TransitionConsolidated Statements of Income TransitionConsolidated Statements of Income TransitionConsolidated Statements of Income Transitionmillion yenFY3/2014 FY3/2015 FY3/2016 FY3/2017 FY3/2018 Net sales571,726 549,780 504,459 489,095 1,055,682 Cost of sales408,506 335,196 283,494 290,197 652,141 Gross profit163,219 214,584 220,965 198,898 403,540 (Gross profit ratio)( ) ( ) ( ) ( ) ( )
2 Selling, general and administrative expenses209,645 189,814 188,083 169,535 225,983 Operating profit-46,425 24,770 32,881 29,362 177,557 (Operating profit ratio)( )( )( )( ) ( )Non-operating income53,136 46,043 14,550 28,593 23,509 (of which foreign exchange gains)(39,287) (34,051)( - )( - )( - )Non-operating expenses624 283 18,641 7,591 1,710 (of which foreign exchange losses)( - )( - ) (18,356)(5,256)(766)Ordinary profit6,086 70,530 28,790 50,364 199,356 (Ordinary profit ratio)( ) ( )( ) ( ) ( )
3 Extraordinary income4,922 3,737 407 64,775 3,240 Extraordinary losses79 2,176 1,482 409 1,507 Profit before income taxes10,929 72,091 27,715 114,730 201,090 Income taxes34,132 30,228 11,197 12,147 60,144 Profit-23,202 41,862 16,518 102,582 140,945 Profit attributable to non-controlling interests20 18 13 8 1,354 Profit attributable to owners of parent-23,222 41,843 16,505 102,574 139,590 (Profit attributable to owners of parent ratio)( )( )( ) ( ) ( )- 1 - Nintendo Co., Consolidated Statements of Income TransitionQuarterly Consolidated Statements of Income TransitionQuarterly Consolidated Statements of Income TransitionQuarterly Consolidated Statements of Income Transitionmillion yen Total TotalNet sales61,969 74,843 174,308 177,974 489,095 154,069 219,971 482,971 198,669 1,055,682 Cost of sales31,436 43,796 95,823 119,141 290,197 89,339 140,985 300,382 121,434 652,141 Gross profit30,532 31,047 78,485 58,832 198.
4 898 64,729 78,986 182,588 77,235 403,540 (Gross profit ratio)( ) ( ) ( ) ( ) ( ) ( ) ( ) ( ) ( ) ( )Selling, general and administrative expenses35,667 31,860 46,222 55,785 169,535 48,520 55,234 66,087 56,140 225,983 Operating profit-5,134 -812 32,262 3,047 29,362 16,208 23,752 116,500 21,094 177,557 (Operating profit ratio)( ) ( ) ( ) ( ) ( ) ( ) ( ) ( ) ( ) ( )Non-operating income1,869 13,709 8,259 4,755 28,593 15,105 15,117 8,651 -15,364 23,509 (of which foreign exchange gains)( - ) ( - ) (1,405) (-1,405) ( - ) (7,139) (9,206) (3,917)(-20,264)( - )Non-operating expenses35,409 5,105 -39,471 6,547 7,591 353 239 179 937 1,710 (of which foreign exchange losses)(35,003) (4,907)(-39,911)(5,256) (5,256)( - ) ( - ) ( - ) (766) (766)
5 Ordinary profit-38,674 7,791 79,993 1,254 50,364 30,960 38,630 124,972 4,792 199,356 (Ordinary profit ratio)( ) ( ) ( ) ( ) ( ) ( ) ( ) ( ) ( ) ( )Extraordinary income5 62,947 803 1,018 64,775 409 2,361 469 0 3,240 Extraordinary losses18 7 167 215 409 6 1,147 274 78 1,507 Profit before income taxes-38,688 70,731 80,629 2,057 114,730 31,363 39,844 125,167 4,714 201,090 Income taxes-14,157 7,895 15,955 2,453 12,147 9,568 8,967 40,716 891 60,144 Profit-24,530 62,835 64,673 -396 102,582 21,795 30,876 84,450 3,822 140.
6 945 Profit attributable to non-controlling interests4 1 4 -1 8 534 634 789 -603 1,354 Profit attributable to owners of parent-24,534 62,833 64,669 -394 102,574 21,260 30,242 83,661 4,425 139,590 (Profit attributable to owners of parent ratio)( ) ( ) ( ) ( ) ( ) ( ) ( ) ( ) ( ) ( ) 3/2017 3/2018- 2 - Nintendo Co., Currency Transaction InformationForeign Currency Transaction InformationForeign Currency Transaction InformationForeign Currency Transaction InformationConsolidated Net Sales in Foreign Currencies USD billionEuro billionNon-Consolidated Purchases in Dollars billionAverage Exchange Ratesyen 1 USD Euro dollars/eurosFY3/20173/31/2017 6/30/2017 9/30/2017 12/31/2017 3/31/2018 Cash and deposits (USD)
7 2,1812,2272,1431,9922,069 Accounts receivable-trade (USD)5004469321,0221,853 Accounts payable-trade (USD)5316541,1601,4851,058 Loans payable to subsidiaries USD 300300300300300 Cash and deposits (Euro)495522548604571 Accounts receivable-trade (Euro)333365739918403 Exchange RatesyenFY3/20173/31/2017 6/30/2017 9/30/2017 12/31/2017 3/31/20181 billionFY3 billionFY3 billionFY3 billionFY3/2018FY3 Assets and Liabilities in Foreign Currencies (Non-Consolidated) FY3 3 - Nintendo Co.
8 , IndicatorsKey IndicatorsKey IndicatorsKey IndicatorsProportion of Overseas of Hardware of First-Party Software Sales in Japanese billion billion billion billion billion billion billion billionProportion of Digital billionFY3 billionFY3 "Download sales" has been renamed to "Digital sales." Digital sales include downloadable versions of packaged software, download-only software and add-on content. Proportion of hardware(including accessories) sales to total dedicated video game platform sales Proportion of overseas(outside of Japan) sales to total sales Proportion of first-party software sales to total dedicated video game software sales Proportion of digital sales to total dedicated video game software sales- 4 - Nintendo Co.
9 , Titles of Nintendo ProductsMillion-Seller Titles of Nintendo ProductsMillion-Seller Titles of Nintendo ProductsMillion-Seller Titles of Nintendo ProductsNintendo SwitchSUPER MARIO ODYSSEYM ario Kart 8 DeluxeSplatoon 2 The Legend of Zelda: Breath of the WildARMS1-2-SwitchXenoblade Chronicles 2 Kirby Star AlliesPOKK N TOURNAMENT DX * Nintendo 3 DSPok mon Ultra Sun/Pok mon Ultra MoonMario Kart 7 New Super Mario Bros. 2[Notes] Software sales units include the quantity bundled with hardware. Software sales units include their downloadable versions.
10 Software sales units include their downloadable versions.*This title is published by The Pok mon Company in the domestic ,0411,0411,0411,041922922922922units in ten thousandsFY3/2018(Apr.'17-Mar.'18)Life-t o-dateGlobalof whichGlobalJapan Overseas1,0411,0411,0411,041922922922922 1911688507541851851851856026026026025725 7257257226170341501602602602602848848848 8481851851851854713822922922922913113113 1131133133133133182182182182515128167751 7517517512445077517517517511341341341341 3113113113132311031011,7041,7041,7041,70 41,2611,2611,2611,2611261261261261161161 1611650 75116126126126126116116116116- 5 - Nintendo Co.