Transcription of Noise Power Ratio (NPR) Testing of HF Receivers
1 1 Noise Power Ratio (NPR) Testing of HF Receivers - Using notched Noise to evaluate dynamic receiver performance by Adam Farson, VA7OJ/AB4OJ A. Introduction. Noise - Power Ratio (NPR) Testing is a performance test technique in which a notched Noise -band is applied to the input of the DUT, and the output of the DUT is connected to a selective level meter whose bandwidth is less than that of the notch in the Noise spectrum. The ICN (idle-channel Noise ) is measured with the Noise -band (1) not notched and (2) notched The theory behind the NPR test is that the incident Noise outside the notch will cause reciprocal mixing Noise and multiple IMD products, which will appear in the idle channel (the passband of the selective level meter) and raise the ICN (idle-channel Noise ). This test method is used in characterising multi-channel FDM/FM systems (terrestrial microwave and satcom), where a notched Noise -band of equal bandwidth to the baseband is applied at the transmit end, and a receiver with a channel filter as wide as (or narrower than) the notch is used to measure ICN with and without the notch inserted in the Noise -band.
2 When Testing an HF receiver, the receiver itself serves as the selective level meter. The test requires the IF bandwidth to be no wider than the bottom of the notch; the IF filter must not be wide enough to allow Noise outside the notch to spill over into the IF. A bandpass (band-limiting) filter following the Noise generator determines the total Noise -band width. illustrates a typical Noise -band as defined by the band-limiting filter, with inserted notches as defined by the bandstop filters. B. Derivation of NPR; Noise -bandwidth considerations. NPR for a given Noise bandwidth (or equivalent number of channels) is the reciprocal of the Ratio of the Noise Power in the notched band to the Power in an equal bandwidth adjacent to the notch. I2 VGO has shown (Ref. 4) that for a given Noise bandwidth, and at the optimum Noise -loading point (see D below), NPR = PTOT - BWR - MDS (1) where PTOT = total Noise Power in dBm in the Noise bandwidth BRF BWR = 10 log10 (BRF/BIF) BRF = RF bandwidth or Noise bandwidth in Hz (RS-50 band-limiting filter) BIF = receiver IF filter bandwidth in Hz MDS = minimum discernible signal (specified at BIF) This relationship can also be expressed as follows: NPR = DN + 10 log10 BIF - MDS (1a) where DN = Noise density in dBm/Hz = PTOT 10 log10 BRF Note that Noise density DN is independent of RF bandwidth.
3 The band-limiting filter selected for each test case should be wider than the DUT s front end, to ensure that the NPR test subjects all stages of the receiver to Noise loading including any front-end filter or preselector. Thus, any effects which the incident Noise generates in the front-end filter will be taken into account in the NPR measurement. To put the impact of the NPR test into perspective, a -9 dBm PTOT level at MHz BRF is equivalent to 1200 simultaneous SSB signals at -43 dBm each, S9 + 30 dB! 2 : Band-limiting filter response, including notches. Note: Spectrum analyser NPR can be read directly from displayed notch depth. C. Notch (bandstop) filter design considerations (see Fig. 5): 1. The stopband width (notch width) at maximum attenuation must be greater than the IF bandwidth at which the receiver will be tested. It should also be wide enough to allow for any possible frequency drift in the filter. 2. The attenuation required in the stopband must be sufficient to prevent any direct transfer of Noise to the receiver under test at its tuned frequency.
4 Thus, if DTOT is Power spectral density (PSD) of the applied Noise -band in dBm/Hz, Bn is stopband width in Hz and An is stopband attenuation in dB, and MDS is the receiver s minimum discernible signal in dBm, the measuring system must satisfy Equation 2. (DTOT + 10 log10Bn ) - An MDS (2) Ref. 7 gives a correction factor which should be applied if the measured NPR is close to the notch depth of the bandstop filter. NPR = 10 log10 {10-(NPRm/10) 10-(An/10)} (3) where NPRm is the measured NPR and An is the stopband attenuation of the bandstop filter. D. Determination of optimum Noise loading: Ref. 3, Section , describes the NPR curve of a typical multi-channel transmission system as a function of Noise loading. At low incident Noise Power levels, thermal Noise is dominant, and NPR is roughly proportional to Noise loading, where an increase of 1 dB increases NPR by 1 dB. This curve is also presented in , and in Ref. 4, Slide 28. 3 : Optimum NPR as a function of Noise loading.
5 As the Noise loading level is further increased, the NPR increase is less than that in input Power due to the effect of intermodulation (IMD) products. At a certain Noise -loading level, IMD products begin to predominate over thermal Noise and NPR starts to decrease. The turnover point is the optimum Noise loading level , at which the receiver s NPR will be measured. Per Ref. 4, the optimum Noise loading level is determined for each test case by increasing Noise loading until ICN (idle-channel Noise ) is 3 dB above the level when the Noise generator is switched off (ICN at MDS). This greatly simplifies the measurement of NPR on Receivers . The NPR falls off rapidly at very high Noise -loading levels. The slope on the right-hand side of the curve ( Noise loading > optimum value) is steeper since the IMD products are dominant in this case. Any direct transfer of Noise due to the limited stopband attenuation of the notch filter will add to the IMD Noise , thus reducing the optimum Noise loading value.
6 This effect will be negligible if the notch depth satisfies Equation (2) above (as is the case for the W&G RS-50). E. NPR test instrumentation. The author was fortunate enough to locate a Wandel & Goltermann RS-50 White Noise Generator on the surplus test-equipment market. This generator, together with its companion RE-50 Noise receiver forms the RK-50 NPR test system used for many years in the telecommunications industry. The RS-50 is illustrated in Fig. 6. The RS-50 generates a 6 MHz Noise -band. Its output level is adjustable from -51 to +15 dBm. The instrument is fitted with 3 band-limiting filters and 6 bandstop filters covering CCITT (ITU-T) standard FDM baseband widths and test channel frequencies. In Fig. 3, the 5340 kHz filter is shown; its stopband width and attenuation are kHz and 97 dB respectively. The RS-50 incorporates a precision attenuator (1 and dB steps) and an ALC loop which holds the output constant at any level setting, irrespective of which filters are selected.
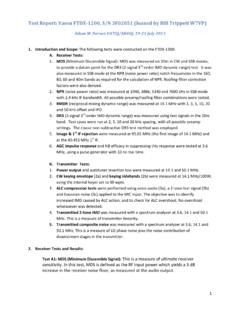
7 Fig. 3 illustrates the test setup for NPR Testing of an HF receiver. 4 F. NPR test procedure (conventional Receivers ): 1. Set RX IF bandwidth/mode to kHz SSB. Select SHARP shape factor (if applicable) The IF bandwidth should be narrower than the stopband width of the notch filter. Noise Blanker (NB), Noise Reduction (NR), Attenuator (ATT) and Preamp are all OFF. RF GAIN is at maximum. Select 6 kHz roofing filter (if applicable), and set AGC to MID. Tune DUT such that the IF passband is centred in the notch. If the DUT has a switchable preselector, this should be ON initially. 2. On RS-50, set RF attenuator to minimum (-50 dBm). Press and hold GENERATOR BLOCKING key and adjust receiver AF GAIN for 0 dBr reading on the RMS voltmeter connected to the baseband (audio) output. 3. On RS-50, release GENERATOR BLOCKING key. Adjust attenuator for a +3 dBr reading on RMS voltmeter. Record attenuator setting: this is PTOT (total Noise Power ). 4. Calculate NPR using Equation 1 (refer to B.)
8 Above): NPR = PTOT - BWR - MDS 5. Repeat test with different combinations of preselector, roofing filter and preamp, and record results. Take each reading 2 3 times and average for highest accuracy. G. NPR test procedure (direct-sampling SDR Receivers ): When Testing NPR on a direct-sampling SDR receiver, the Noise loading level required to raise ICN by 3 dB may exceed the clipping (0 dBFS) point of the receiver s ADC. Thus, it is more convenient to increase the Noise loading until the onset of clipping is reached, then back off the Noise level until no clipping indication occurs for at least 10 seconds ( , Slide 36.) NPR can then be read directly off the spectrum scope display or the signal-strength meter. 1. Set RX detection bandwidth/mode to kHz SSB. Select SHARP shape factor (if applicable) The detection bandwidth should be narrower than the stopband width of the notch filter. Noise Blanker (NB), Noise Reduction (NR), Attenuator (ATT), Dither and Preamp are all OFF.
9 RF GAIN is at maximum. Set AGC to SLOW. Tune DUT such that the detection channel passband is centred in the notch. If the DUT has a switchable preselector, this should be ON initially. Spectrum scope averaging should be ON, at mid-range. 2. On RS-50, set RF attenuator to minimum (-50 dBm). Press and hold GENERATOR BLOCKING key to turn off Noise output, and read MDS from DUT s signal-strength indicator or bottom of notch on spectrum display. Record MDS reading (in dBm). 3. On RS-50, release GENERATOR BLOCKING key. Adjust attenuator until ADC just clips, then back off until no clipping is observed over 10 sec. Record attenuator setting: this is PTOT (total Noise Power ). Read Noise Power from DUT s signal-strength indicator or bottom of notch on spectrum display. Record signal-strength reading (in dBm). 4. Now tune DUT to a frequency well outside the notch and read Noise Power on signal-strength indicator. Record signal-strength reading (in dBm). 5. NPR equals the difference between the signal-strength readings taken in steps 4 and 3.
10 6. Repeat test with different combinations of preselector, dither and preamp, and record results. Take each reading 2 3 times and average for highest accuracy. 7. NPR can also be read off the spectrum display by positioning the marker well outside the notch and in the center of the stopband. NPR is the difference between these two readings. (Refer to Fig. 4.) 5 NPR spectrogram on Perseus spectrum scope. H. Measurement results (with kHz band-limiting & 5340 kHz bandstop filters) Tables 1, 1a and 2 present the NPR test results for the radios tested with the W&G RS-50 fitted with kHz band-limiting and 5340 kHz bandstop filters. BRF = MHz, BWR = dB (except where noted), 1200 equivalent voice channels. The Kenwood TS-590S was tested with the kHz band-limiting and 5340 kHz bandstop filters to select the High 1st IF ( MHz), and also with the kHz band-limiting and 3886 kHz bandstop filters to select the Inband 1st IF ( MHz). For the latter filters, BRF = MHz, BWR = dB, 960 equivalent voice channels.