Transcription of Nonlinear Functions - UH
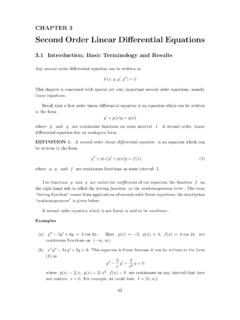
1 Nonlinear Functions By definition, Nonlinear Functions are Functions which are not linear . quadratic Functions are one type of Nonlinear function. We discuss several other Nonlinear Functions in this section. A. Absolute Value Recall that the absolute value of a real number x is defined as if 0if x<0xxxx = Consequently, the graph of the function ()fxx= is made up of two different pieces. For x > 0, the graph is the graph of the linear function x, and for x < 0, the graph is the graph of the linear function x . We show the three different graphs below. ()fxx= for x > 0 ( )fxx= for x < 0 ()fxx= The graph of ()gxx= can be obtained from the graph of ()fxx= by reflecting the graph across the x axis.
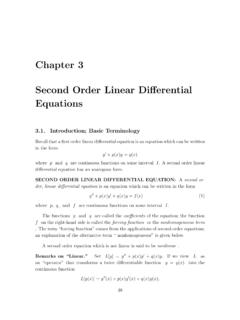
2 Reflecting ()fxx= across the x axis to obtain the graph of ()gxx= We give the graphs of ()fxx= and ()gxx= together below for easy reference. ()fxx= ()gxx= The graphs of ()fxx= and ()gxx= above can be used to graph shifts and scalings of ()fxx=. Example: The graph of the function () 21 3gxx= can be given in 3 steps. We start by graphing the function () 2fxx= by scaling the graph of x by a factor of 2. Then we shift this graph 1 unit in the x direction. Finally, we shift -3 units in the y direction. The process is demonstrated below. Scaling x by 2. Shifting 1 unit in the x direction.
3 Shifting 3 units in the y direction. Example: The graph of the function 1()12gxx= + can be given in 2 steps. We start by graphing the function 1()2fxx= by scaling the graph of x by a factor of 1/2. Then we shift this graph -1 unit in the x direction. Scaling x by -1/2. Shifting -1 unit in the x direction. Example: We can graph the function () 2 1gxx= as a shift and scaling of the function ()fxx=. First, note that 11212222xx x = = . So, we can rewrite g in the form 1() 22gxx= . Now we can recognize that g is the result of scaling the function ()fxx= by a factor of 2, and then shifting the result units in the x direction.
4 The result is shown below. Scaling ()fxx= by a factor of 2. Shifting the result units in the x direction. Example: We can see from the example above that the graph of the function () 2 1gxx= is made up of two lines. The equations for these line, along with the restrictions on x can be found by using the definition of absolute value. First, recall that if 0if 0aaaaa = < Consequently, ()21 if 21021if 21021 21if 21021if 210xxxxxxxxx == < + < We can solve the inequality 210x as follows. 1210 2 1 2xxx If we combine this information with the definition of g, we have 21if 1/2() 2 121if 1/2xxgxxxx = = + < So, g is a piecewise function, made up of two linear Functions .
5 More precisely, ( )21 if 1/ 2gxxx= and ( )21 if 1/ 2gxxx= + < Remark: A function written in the form if ()if ax bx cGxdx ex c+ = +< is said to be a piecewise linear function. Notice that the function in the example above is an example of a piecewise linear function. In that example, the values a, b, c, d and e are given by 2, -1, , -2 and 1 respectively. Exercises: 1. Describe how to obtain the graph of the function () 3fxx= from the graph of ()Qxx=. Then graph the function. 2. Describe how to obtain the graph of the function ()2 Fxx= from the graph of ()Qxx=.
6 Then graph the function. 3. Describe how to obtain the graph of the function () 21hxx= from the graph of ()Qxx=. Then graph the function. 4. Describe how to obtain the graph of the function ()1 Gxx= + from the graph of ()Qxx=. Then graph the function. 5. Describe how to obtain the graph of the function 1()1 22 Rxx= + from the graph of ()Qxx=. Then graph the function. 6. Describe how to obtain the graph of the function ()1 3 Txx=+ from the graph of ()Qxx=. Then graph the function. 7. Describe how to obtain the graph of the function () 3 2 Hxx= from the graph of ()Qxx=. Then graph the function.
7 8. Describe how to obtain the graph of the function () 2 4 1 Hxx=+ from the graph of ()Qxx=. Then graph the function. 9. Use the definition of absolute value to write the function ()1 Gxx= + as a piecewise linear function. 10. Use the definition of absolute value to write the function ()1 3 Txx=+ as a piecewise linear function. 11. Use the definition of absolute value to write the function 1()1 22 Rxx= + as a piecewise linear function. 12. Use the definition of absolute value to write the function () 3 2 Hxx= as a piecewise linear function. 13. Use the definition of absolute value to write the function () 2 4 1 Mxx=+ as a piecewise linear function.
8 B. Polynomial Functions We have already seen some special types of polynomial Functions . A linear function ()fxmxb=+ is a first degree polynomial function. A quadratic function 2()g xaxbx c=++ is a second degree polynomial function. In general, an thn degree polynomial function is a function of the form 10()nnFx axax a=++ +" where {}0,1, 2, ..n and 10,.., ,naaa \ with 0na . Examples: 1. () 1fx= is a polynomial of degree 0. 2. 14()23 Hxx= is a polynomial of degree 1. 3. 23()311 Rxxx= + is a polynomial of degree 2. 4. 724()333 Fxxxx= + is a polynomial of degree 7.
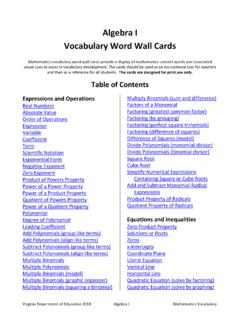
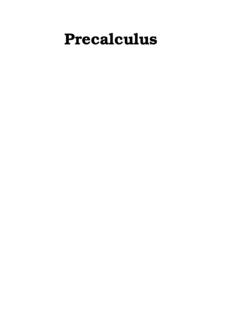
9 The graphs of polynomial Functions can sometimes be very complicated. For example the graph of 74 21()24 1100 Fxxxxx= + is shown below. 74 21()24 1100 Fxxxxx= + One class of polynomial Functions which have predictable graphs is given by ()nFx x= where {}0,1, 2, ..n . If n is an even natural number, then the graph of ( )nFx x= has a graph that is similar to the graph of 2()fxx=. ()nFx x= when n is even. Although these graphs are similar, they are not called parabolas. The graph of 3()fxx= is shown below along with a table of values for the function.
10 X 3x -2 -8 -1 -1 0 0 1 1 2 8 -10-8-6-4-20246810-3-2-10123 If 3n is an odd natural number, then the graph of ( )nFx x= has a graph that is similar to the graph of 3()fxx=.