Transcription of Nonlinear Functions - UH
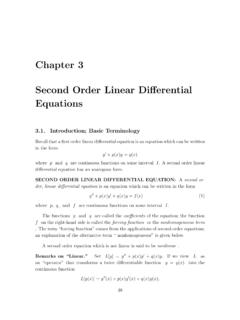
1 Nonlinear Functions By definition, Nonlinear Functions are Functions which are not linear. Quadratic Functions are one type of Nonlinear function. We discuss several other Nonlinear Functions in this section. A. Absolute Value Recall that the absolute value of a real number x is defined as if 0if x<0xxxx = Consequently, the graph of the function ()fxx= is made up of two different pieces. For x > 0, the graph is the graph of the linear function x, and for x < 0, the graph is the graph of the linear function x . We show the three different graphs below. ()fxx= for x > 0 ( )fxx= for x < 0 ()fxx= The graph of ()gxx= can be obtained from the graph of ()fxx= by reflecting the graph across the x axis.
2 Reflecting ()fxx= across the x axis to obtain the graph of ()gxx= We give the graphs of ()fxx= and ()gxx= together below for easy reference. ()fxx= ()gxx= The graphs of ()fxx= and ()gxx= above can be used to graph shifts and scalings of ()fxx=. Example: The graph of the function () 21 3gxx= can be given in 3 steps. We start by graphing the function () 2fxx= by scaling the graph of x by a factor of 2. Then we shift this graph 1 unit in the x direction. Finally, we shift -3 units in the y direction. The process is demonstrated below. Scaling x by 2. Shifting 1 unit in the x direction. Shifting 3 units in the y direction. Example: The graph of the function 1()12gxx= + can be given in 2 steps.
3 We start by graphing the function 1()2fxx= by scaling the graph of x by a factor of 1/2. Then we shift this graph -1 unit in the x direction. Scaling x by -1/2. Shifting -1 unit in the x direction. Example: We can graph the function () 2 1gxx= as a shift and scaling of the function ()fxx=. First, note that 11212222xx x = = . So, we can rewrite g in the form 1() 22gxx= . Now we can recognize that g is the result of scaling the function ()fxx= by a factor of 2, and then shifting the result units in the x direction. The result is shown below. Scaling ()fxx= by a factor of 2. Shifting the result units in the x direction.
4 Example: We can see from the example above that the graph of the function () 2 1gxx= is made up of two lines. The equations for these line, along with the restrictions on x can be found by using the definition of absolute value. First, recall that if 0if 0aaaaa = < Consequently, ()21 if 21021if 21021 21if 21021if 210xxxxxxxxx == < + < We can solve the inequality 210x as follows. 1210 2 1 2xxx If we combine this information with the definition of g, we have 21if 1/2() 2 121if 1/2xxgxxxx = = + < So, g is a piecewise function, made up of two linear Functions .
5 More precisely, ( )21 if 1/ 2gxxx= and ( )21 if 1/ 2gxxx= + < Remark: A function written in the form if ()if ax bx cGxdx ex c+ = +< is said to be a piecewise linear function. Notice that the function in the example above is an example of a piecewise linear function. In that example, the values a, b, c, d and e are given by 2, -1, , -2 and 1 respectively. Exercises: 1. Describe how to obtain the graph of the function () 3fxx= from the graph of ()Qxx=. Then graph the function. 2. Describe how to obtain the graph of the function ()2 Fxx= from the graph of ()Qxx=. Then graph the function. 3. Describe how to obtain the graph of the function () 21hxx= from the graph of ()Qxx=.
6 Then graph the function. 4. Describe how to obtain the graph of the function ()1 Gxx= + from the graph of ()Qxx=. Then graph the function. 5. Describe how to obtain the graph of the function 1()1 22 Rxx= + from the graph of ()Qxx=. Then graph the function. 6. Describe how to obtain the graph of the function ()1 3 Txx=+ from the graph of ()Qxx=. Then graph the function. 7. Describe how to obtain the graph of the function () 3 2 Hxx= from the graph of ()Qxx=. Then graph the function. 8. Describe how to obtain the graph of the function () 2 4 1 Hxx=+ from the graph of ()Qxx=. Then graph the function. 9. Use the definition of absolute value to write the function ()1 Gxx= + as a piecewise linear function.
7 10. Use the definition of absolute value to write the function ()1 3 Txx=+ as a piecewise linear function. 11. Use the definition of absolute value to write the function 1()1 22 Rxx= + as a piecewise linear function. 12. Use the definition of absolute value to write the function () 3 2 Hxx= as a piecewise linear function. 13. Use the definition of absolute value to write the function () 2 4 1 Mxx=+ as a piecewise linear function. B. Polynomial Functions We have already seen some special types of polynomial Functions . A linear function ()fxmxb=+ is a first degree polynomial function. A quadratic function 2()g xaxbx c=++ is a second degree polynomial function.
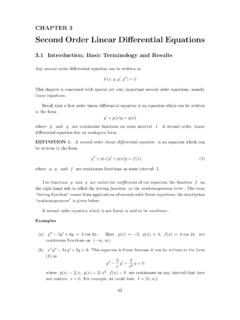
8 In general, an thn degree polynomial function is a function of the form 10()nnFx axax a=++ +" where {}0,1, 2, ..n and 10,.., ,naaa \ with 0na . Examples: 1. () 1fx= is a polynomial of degree 0. 2. 14()23 Hxx= is a polynomial of degree 1. 3. 23()311 Rxxx= + is a polynomial of degree 2. 4. 724()333 Fxxxx= + is a polynomial of degree 7. The graphs of polynomial Functions can sometimes be very complicated. For example the graph of 74 21()24 1100 Fxxxxx= + is shown below. 74 21()24 1100 Fxxxxx= + One class of polynomial Functions which have predictable graphs is given by ()nFx x= where {}0,1, 2, ..n . If n is an even natural number, then the graph of ( )nFx x= has a graph that is similar to the graph of 2()fxx=.
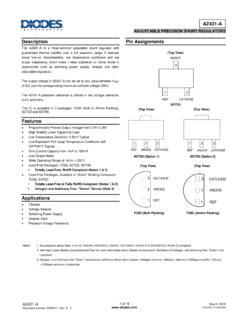
9 ()nFx x= when n is even. Although these graphs are similar, they are not called parabolas. The graph of 3()fxx= is shown below along with a table of values for the function. x 3x -2 -8 -1 -1 0 0 1 1 2
10 8 -10-8-6-4-20246810-3-2-10123 If 3n is an odd natural number, then the graph of ( )nFx x= has a graph that is similar to the graph of 3()fxx=. Example: The graph of ()3()1 Pxx=+ can be obtained by shifting the graph of 3()fxx= by -1 unit in the x direction. Example: The graph of 4()1Px x=+ can be obtained by shifting the graph of 4()fxx= by 1 unit in the y direction. Example: The graph of 4()8 Pxx= + can be obtained by reflecting the graph of 4()gx x= across the x axis, and then shifting the result 8 units in the y direction. The process is shown below. 4()gx x= Reflection of 4()gx x= across the x axis.