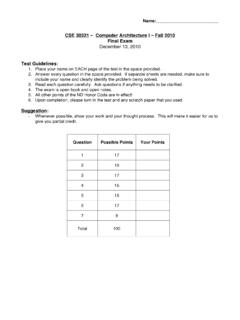
Transcription of Normal Distributions - University of Notre Dame
1 Normal DistributionsSo far we have dealt with random variables with a finitenumber of possible values. For example; ifXis the numberof heads that will appear, when you flip a coin 5 times,Xcan only take the values 0,1,2,3,4,or variables can take a continuous range of values, forexample a variable such as the height of 2 year old childrenin the population or the lifetime of an electroniccomponent. For a continuous random variableX, theanalogue of a histogram is a continuous curve (theprobability density function) and it is our primary tool infinding probabilities related to the variable. As with thehistogram for a random variable with a finite number ofvalues, the total area under the curve equals DistributionsProbabilities correspond to areas under the curve and arecalculated over intervals rather than for specific values ofthe random many types of probability density functionscommonly occur, we will restrict our attention to randomvariables with Normal Distributions and the probabilitieswill correspond to areas under aNormal Curve(ornormal density function).
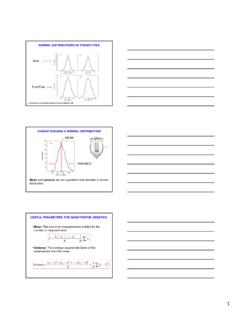
2 This is the most important example of a continuousrandom variable, because of something called theCentralLimit Theorem: givenanyrandom variable withanydistribution, the average (over many observations) of thatvariable will (essentially) have a Normal distribution. Thismakes it possible, for example, to draw reliable informationfrom opinion DistributionsThe shape of a Normal curve depends on two parameters, and , which correspond, respectively, to the mean andstandard deviation of the population for the associatedrandom variable. The graph below shows a selection ofNormal curves, for various values of and . The curve isalways bell shaped, and always centered at the mean .Larger values of give a curve that is more spread area beneath the curve is always of a Normal Curve1.
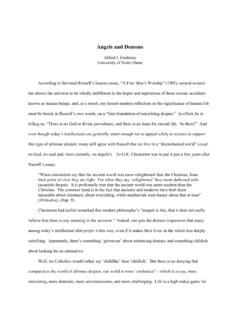
3 All Normal Curves have the same general bell The curve is symmetric with respect to a vertical linethat passes through the peak of the The curve is centered at the mean which coincideswith the median and the mode and is located at thepoint beneath the peak of the The area under the curve is always The curve is completely determined by the mean andthe standard deviation . For the same mean, , asmaller value of gives a taller and narrower curve,whereas a larger value of gives a flatter The area under the curve to the right of the mean and the area under the curve to the left of themean is of a Normal Curve7. The empirical rule (68%, 95%, ) for moundshaped data applies to variables with example, approximately 95% of the measurementswill fall within 2 standard deviations of the mean, the interval ( 2 , + 2 ).
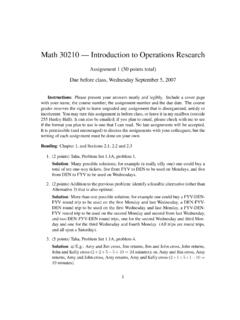
4 8. If a random variableXassociated to an experimenthas a Normal probability distribution, the probabilitythat the value ofXderived from a single trial of theexperiment is between two given valuesx1andx2(P(x16X6x2)) is the area under the associatednormal curve betweenx1andx2. For any given valuex1,P(X=x1) = 0, soP(x16X6x2) =P(x1< X < x2).Properties of a Normal CurveHere are a couple of pictures to illustrate items 7 and approx. 2 + 2 The standard Normal curveThestandard Normal curveis the Normal curve withmean = 0 and standard deviation = will see later how probabilities for any Normal curve canbe recast as probabilities for the standard Normal the standard Normal , probabilities are computed eitherby means of a computer/calculator of via a under the Standard Normal CurvezArea =A(z)=P(Z6z)Probabilities for the standard NormalThe table consists of two columns.
5 One (on the left) gives avalue for the variablez, and one (on the right) gives a valueA(z), which can be interpreted in either of two ways:zA(z) (z) = the area under the standard Normal curve ( = 0and = 1) to the left of this value ofz, shown as theshaded region in the diagram on the next (z) = the probability that the value of the randomvariableZobserved for an individual chosen at randomfrom the population is less than or equal (z) =P(Z6z).Probabilities for the standard NormalThe shaded area isA(1) = , correct to 4 section of the table shown above tells us that the areaunder the standard Normal curve to the left of the valuez= 1 is It also tells us that ifZis normallydistributed with mean = 0 and standard deviation = 1,thenP(Z61) =. a standard Normal random variable, what isP(Z62)?
6 Sketch the region under the standard normalcurve whose area is equal toP(Z62). Use the table tofindP(Z62).P(Z62) = a standard Normal random variable, what isP(Z6 1)? Sketch the region under the standard normalcurve whose area is equal toP(Z6 1).P(Z6 1) = to the right of a valueRecall now that the total area under the standard normalcurve is equal to 1. Therefore the area under the curve totherightof a given valuezis 1 A(z). By the complementrule, this is also equal toP(Z > z).zArea = 1 A(z)=P(Z>z)ExamplesIfZis a standard Normal random variable, use the aboveprinciple to findP(Z>2). Sketch the region under thestandard Normal curve whose area is equal toP(Z>2).P(Z62) = soP(Z>2) = 1 = a standard Normal random variable, findP(Z> 1). Sketch the region under the standard normalcurve whose area is equal toP(Z> 1).
7 P(Z6 1) = soP(Z> 1) = 1 = area between two valuesWe can also use the table to computeP(z1< Z < z2) =P(z16Z < z2) =P(z1< Z6z2) =P(z16Z6z2) =A(z2) A(z1).z1z2 Area =A(z2) A(z1)=P(z1< Z < z2)Our previous examples can be thought of like this:P(Z6z) =P( < Z6z) =A(z) A( ) =A(z)P(z < Z) =P(z < Z < ) =A( ) A(z) = 1 A(z)ExampleIfZis a standard Normal random variable, findP( 36Z63). Sketch the region under the standardnormal curve whose area is equal toP( 36Z63).P( 36Z63) =P(Z63) P(Z6 3) = = Rule for the standard normalIf data has a Normal distribution with = 0, = 1, wehave the following empirical rule:IApproximately 68% of the measurements will fallwithin 1 standard deviation of the mean orequivalently in the interval ( 1,1).IApproximately 95% of the measurements will fallwithin 2 standard deviations of the mean orequivalently in the interval ( 2,2).
8 IApproximately of the measurements (essentiallyall) will fall within 3 standard deviations of the mean,or equivalently in the interval ( 3,3).Verifying the empirical ruleP( 16Z61) =P(Z61) P(Z6 1) = = ( 26Z62) =P(Z62) P(Z6 2) = = (a) Sketch the area beneath the density function of thestandard Normal random variable, corresponding toP( ), and find the ( ) =P( ) P(Z6 ) = = (b) Sketch the area beneath the density function of thestandard Normal random variable, corresponding toP( ) and find the ( ) = (c) Sketch the area beneath the density function of thestandard Normal random variable, corresponding toP( ) and find the ( ) = 1 (P( ))= 1 = Normal Random VariablesRecall how we used the empirical rule to solve the followingproblem:The scores on the LSAT exam, for a particular year, arenormally distributed with mean = 150 points andstandard deviation = 10 points.
9 What percentage ofstudents got a score between 130 and 170 points in thatyear (or what percentage of students got a Z-score between-2 and 2 on the exam)?LSAT Scores distribution and US Law of 36/24/07 2:15 PM General Normal Random VariablesLSAT Scores distribution and US Law of 36/24/07 2:15 PM We will now use Normal distribution tables to solve thiskind of problem. We do not have a table for every normalrandom variable (there are infinitely many of them!). So wewill convert problems about general Normal random toproblems about the standard Normal random variable, bystandardizing converting all relevant values of thegeneral Normal random variable toz-scores, and thencalculating probabilities of thesez-scores from a standardnormal table (or using a calculator).
10 StandardizingIfXis a Normal random variable with mean and standarddeviation , then the random variable Z defined byZ=X z-score ofZ has a standard Normal distribution. The value ofZgivesthe number of standard deviations betweenXand themean (negative values are values below the mean,positive values are values above the mean).StandardizingTo calculateP(a6X6b), whereXis a Normal randomvariable with mean and standard deviation :ICalculate thez-scores foraandb, namely (a )/ and (b )/ IP(a6X6b) =P(a 6X 6b )=P(a 6Z6b )whereZis a standard Normal random , thena = and similarly ifb= ,thenb = .IUse a table or a calculator for standard normalprobability distribution to calculate the the length of newborn alligators, X, is normallydistributed with mean = 6 inches and standard deviation = inches, what is the probability that an alligator eggabout to hatch, will deliver a baby alligator between and inches?