Transcription of November 2017 How’s Life in Switzerland? - OECD.org
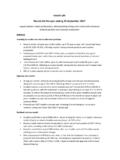
1 How s life inSwitzerland?HOW S life ? 2020 OECD 2020 how s life in switzerland ? switzerland s current well-being, 2018 or latest available year Note: This chart shows switzerland s relative strengths and weaknesses in well-being compared to other OECD countries. Longer bars always indicate better outcomes ( higher wellbeing), whereas shorter bars always indicate worse outcomes (lower well-being) including for negative indicators, marked with an *, which have been reverse-scored. Inequalities (gaps between top and bottom, differences between groups, people falling under a deprivation threshold) are shaded with stripes, and missing data in white. switzerland s resources for future well-being, 2018 or latest available year Note: =top-performing OECD tier, =middle-performing OECD tier, =bottom-performing OECD tier. indicates consistent improvement; indicates no clear or consistent trend; indicates consistent deterioration, and.
2 Indicates insufficient time series to determine trends since 2010. For methodological details, see the Reader s Guide of How s life ? 2020. Genderw age gap*AVERAGEINEQUALIT YHouse-holdincomeHouse-holdw ealthHousingaffordabilityOv er-crow ding rate*Employ-ment rateStudent skills in scienceLong hours in paid w ork*Access to green spaceEx posure to outdoor air pollution*Students w ith lowskills* life ex pectancyGap in life ex pectancy by education (men)*Gender gap in hours w orked*Time offLife satisfactionSocialinter-actionsNegative affect balance*Lack of socialsupport*Voter turnoutHav ing no say in gov ernment*Homicides*Gender gap in feeling safeINCOME AND WEALT HWORKAND JOB QUALIT YHOUSINGWORK- life BALANCEHEALT HKNOWLEDGE ANDSKILLSSOCIAL CONNECT IONSCIVIC ENGAGEMENTENVIRONMENT AL QUALIT YSAFET YSUBJECT IVE WELL-BEINGS80/S20 income share ratio*Natural CapitalEconomic CapitalHuman Capital Social Capital Greenhouse gas emissions per capitaProduced fixed attainment of young adultsTrust in others.
3 Material footprintFinancial net worth of governmentPremature mortalityTrust in governmentRed List Index of threatened speciesHousehold debtLabour underutilisation rateGender parity in politics2 HOW S life ? 2020 OECD 2020 For more information Access the complete publication, including information about the methods used to determine trends at: Find the data used in this country profile at: Deprivations in switzerland Deprivations in selected indicators of current well-being, 2018 or latest available year Note: Relative income poverty refers to the share of people with household disposable income below 50% of the national median; financial insecurity refers to the share of individuals who are not income poor, but whose liquid financial assets are insufficient to support them at the level of the national relative income poverty line for at least three months.
4 Housing cost overburden refers to the share of households in the bottom 40% of the income distribution spending more than 40% of their disposable income on housing costs; and low satisfaction with life and with time use refer to the share of the population rating their satisfaction as 4 or lower (on a 0-10 scale). SWITZERLANDof the population live in relativeincome poverty9%of poor households spend more than40% of their income on housing costs15%say they have no friends or familyto turn to in times of need6%of the population report lowlife satisfaction4%There is no data available on financialinsecurityare not satisfied with how theyspend their time14%Source: OECD (2020),How s life ? 2020: MeasuringWell-Being 3 HOW S life ? 2020 OECD 2020 Inequalities between men and women in switzerland Gender ratios (distance from parity) for selected indicators of current well-being, 2018 or latest available year Note: Grey bubbles denote no clear difference between men and women, defined as gender ratios within points distance to parity.
5 VictimsLong-term unemployment rateEarningsFeeling safeEmployment ratePerceived healthStudent skills (science) life satisfactionSocial supportSatisfaction with personal relationshipsLife expectancyLong working hours (in paid work)Deaths from suicide, alcohol, drugsMen doing betterOECD averageWomen doing better4 HOW S life ? 2020 OECD 2020 Inequalities between age groups in switzerland Age ratios (distance from parity) for selected indicators of current well-being, 2018 or latest available year Note: Age ranges differ according to each indicator and are only broadly comparable. They generally refer to 15-24/29 years for young people, 25/30 to 45/50 years for the middle-aged and 50 years and over for older people. See How s life ? 2020 for further details. Grey bubbles denote no clear difference between age groups, defined as age ratios within points distance to parity.
6 A. Younger and middle-aged peopleB. Younger and older rateEarningsFeeling safeLife satisfactionSatisfaction with personal relationshipsSocial supportSatisfaction with time useLong working hours (in paid work)Middle-aged people doing betterOECD averageYounger people doing with time useEmployment rateLife satisfactionSatisfaction with personal relationshipsSocial supportFeeling safeLong working hours (in paid work)Older people doing betterOECD averageYounger people doing better 5 HOW S life ? 2020 OECD 2020 Inequalities between people with different educational attainment in switzerland Education ratios (distance from parity) for selected indicators of current well-being, 2018 or latest available year Note: Grey bubbles denote no clear difference between groups with different educational attainment, defined as education ratios within points distance to parity.
7 Unemployment rateEarningsPerceived healthEmployment rateFeeling safeLife satisfactionSocial supportSatisfaction with personal relationshipsSatisfaction with time useLong working hours (in paid work)People with tertiary education doing betterOECD averagePeople with upper secondary education doing better6 HOW S life ? 2020 OECD 2020 Inequalities between top and bottom performers in switzerland Vertical inequalities for selected indicators of current well-being, 2018 or latest available year Note: For all figures, countries are ranked from left (most unequal) to right (least unequal). income of the top 20% relative to the bottom 20% of wealth owned by the top 10%, of the top 10% relative to the bottom 10%, full-time employees score in science of the top 10% relative to the bottom 10% satisfaction scores of the top 20% relative to the bottom 20% with time use scores of the top 20%relative to the bottom 20% 7 HOW S life ?
8 2020 OECD 2020 Trends in current well-being since 2010 in switzerland - I Note: The snapshot depicts data for 2018, or the latest available year, for each indicator. The colour of the circle indicates the direction of change, relative to 2010, or the closest available year: = consistent improvement, = consistent deterioration, = no clear trend, and white for insufficient time series to determine trends. The OECD average is marked in black. For methodological details, see the Reader s Guide of How s life ? 2020. * = Purchasing Power Parity. Household income (household net adjusted disposable income, USD at 2017 PPPs*, per capita)AverageHousehold wealth (median net wealth, USD at 2016 PPPs)AverageNo data available for income share ratio (the household income for the top 20%, divided by the household income for the bottom 20%)InequalityHousing affordability (share of disposable income remaining after housing costs) AverageOvercrowding rate (share of households living in overcrowded conditions)InequalityEmployment rate (employed people aged 25-64, as a share of the population of the same age)AverageGender wage gap (difference between male and female median wages expressed as a share of male wages)InequalityLong hours in paid work (share of employees usually working 50+ hours per week)InequalityHealthLife expectancy (number of years a newborn can expect to live)
9 AverageIncome and WealthHousingWork and Job QualityCHE~38 000 OECD~ 28 HOW S life ? 2020 OECD 2020 Trends in current well-being since 2010 in switzerland - II Note: See note on page 7. Knowledge and SkillsStudent skills in science (PISA mean scores)AverageEnvironmental QualityExposure to outdoor air pollution(share of population > WHO threshold)InequalityLife satisfaction (mean value on a 0-10 scale)AverageNegative affect balance (share of population reporting more negative than positive feelings and states yesterday)InequalityHomicides (per 100 000 population)AverageGender gap in feeling safe (percentage difference that women feel less safe than men when walking alone at night)InequalityWork- life BalanceTime off (time allocated to leisure and personal care, hours per day)AverageNo data available for interactions (hours per week)AverageNo data available for of social support (share of people who report having no friends or relatives whom they can count on in times of trouble)
10 InequalityCivic EngagementVoter turnout(share of registered voters who cast votes)AverageSubjective Well-beingSafetySocial