Transcription of NSF 22-314 New Data on U.S. R&D: Summary Statistics from ...
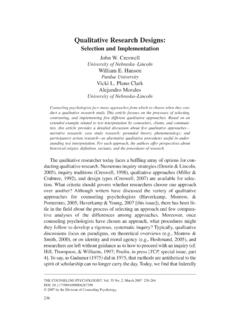
1 National center for Science andEngineering StatisticsFigure 1 Source(s):InfoChartNew Data on R&D: Summary Statistics from the 2019 20 Edition of National Patterns of R&D Resources R&D expenditures, by performing sector and source of funds: 2019 FFRDCs = federally funded research and development center for Science and Engineering Statistics , National Patterns of R&D Resources (annual series).New data on research and experimental development (R&D) expenditures indicate that R&D performance totaled $667 billion in 2019 (figure 1). The business sector accounted for 75% of the R&D performance total; the other larger performers were higher education (12%) and the federal government (federal intramural facilities and federally funded research and development centers) (9%). By source of funds, the largest funders were the business sector (72%) and the federal government (20%).
2 The $667 billion R&D total in 2019 compares with $554 billion in 2017 and $605 billion in 2018. These increases in 2018 and 2019 $51 billion and $62 billion, respectively were large compared with recent history. (The average annual increase in 2010 17 was $21 billion). The estimated total for 2020 is $708 billion a $41 billion increase over the 2019 level. Data are from the National Patterns of R&D Resources series from the National center for Science and Engineering Statistics (NCSES). Further detail will be available in NCSES reports to follow. Suggested Citation: Boroush M; National center for Science and Engineering Statistics (NCSES). 2021. New Data on R&D: Summary Statistics from the 2019 20 Edition of National Patterns of R&D Resources. NSF 22-314 . Alexandria, VA: National Science Foundation. Available at 22-314 |December 2021|Mark Boroush