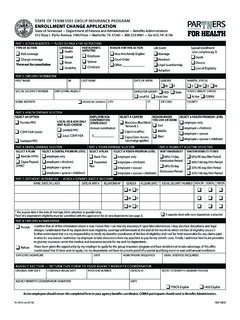
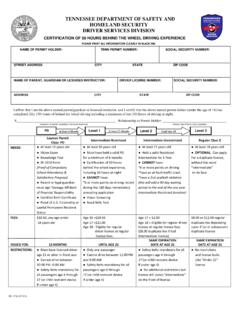
Transcription of ntroduction TN COV D-19 at a Glance - Tennessee
1 COVID-19 Critical IndicatorsMay 21, 2022 IntroductionThe COVID-19 Cri cal Indicator report is published weekly by the Tennessee Department of Health (TDH) tohighlight cri cal data trends at the county and state level. Community transmission and disease burden metricspublished in this report are subject to change and will be reevaluated periodically. TN COVID-19 at a Glance2,051,710 Total Number of COVID-19 Cases1,286 New COVID-19 Cases Today26,371 Total Number ofCOVID-19 Deaths Key DefinitionsBelow are defini ons. In addi on to these defini ons, each visualiza on in this report is explained in further detail inthe technical notes (see page 11): In TN, a COVID-19 case is counted in the daily case count, demographics, and outcomes, if it classified as a confirmed or probable case.
2 Please see the COVID-19 case defini on found at h The specimen collec on date is the date someone's COVID-19 lab sample was collected. Due to lab turnaround me there may be delays between when a specimen is collected and a confirmed case is reported to the public. Unless otherwise stated, visualiza ons in this report use specimen collec on date as it more accurately indicates when a pa ent was sick (and not when their case was reported to the public).This report was produced by the Tennessee Department of Health on May 24, 2022. A confirmed case is someone who tested posi ve (via PCR test) for the virus that casues COVID-19 (SARS-CoV-2). A probable case is someone who tested posi ve by another type of test or may not have been tested at all, buthas an illness consistent with COVID-19, and may have other risk factors.
3 ( contact with a confirmed case.) For example: If a person is a close contact of a COVID-19 case and has a clinically-compa ble illness, this person meets the criteria to be a probable IndicatorsMay 21, 2022 TN COVID-19 Trends: Cases, Hospitalizations, and Deaths COVID-19 Cases by Specimen Collection Date1 This report was produced by the Tennessee Department of Health on May 24, 2|Dec 16, 21 Dec 31, 21 Jan 15, 22 Jan 30, 22 Feb 14, 22 Mar 1, 22 Mar 16, 22 Mar 31, 22 Apr 15, 22 Specimen Collection Date0K5K10K15K20K25 KCOVID-19 Cases0K5K10K15K20K25 KMoving Average of COVID-19 Cases Number/Rate of Hospitalizations13 Dec 16, 21 Dec 31, 21 Jan 15, 22 Jan 30, 22 Feb 14, 22 Mar 1, 22 Mar 16, 22 Mar 31, 22051015202530# of reporting patients per hospital0K1K2K3K4 KPatientsInpa entICUVen Tests by RegionCOVID-19 Critical IndicatorsMay 21, 2022 Number of Deaths per Day (by date of death)
4 8 This report was produced by the Tennessee Department of Health on May 24, 3|On May 21, 2022, the total number of confirmed COVID-19 deaths was 26,371 (19,329 confirmed and 7,074 probable). Beloware the number of COVID-19 deaths by the date of death. The red line represents the 4 day running average number of 16, 21 Dec 31, 21 Jan 15, 22 Jan 30, 22 Feb 14, 22 Mar 1, 22 Mar 16, 22 Mar 31, 22 Date of Death020406080100120 Deaths0204060801001204-Day Moving Average Number of DeathsCase Fatality (26,371/2,051,779)30-Day Case Fatality (66/24,565) Positive Tests per 100,000 Person by Public Health Region (over last 7 days)4 The map below shows the number of new posi ve tests in the last 7 days per 100,000 persons. The arrow indicators represent thetrend (up or down) as compared to the week prior.
5 For the week of May 21, 2022, the highest rate of posi ve tests was seen in theMemphis-Shelby Metro. Addi onally, all of the 13 public health regions saw an increase in the number of posi ve cases compared tothe week COVID-19 Critical IndicatorsMay 21, 2022 This report was produced by the Tennessee Department of Health on May 24, 4|TN OmicronBlountville-Sullivan RegionChattanooga-Hamilton RegionEast Tennessee RegionJackson-Madison RegionKnoxville-Knox RegionMemphis-Shelby RegionMid-Cumberland RegionNashville-Davidson RegionNortheast RegionSouth-Central RegionSoutheast RegionUpper-Cumberland RegionWest Tennessee RegionGrand Total12,0552,2768361162854971,6881,5683, 1273298863946214423718222215101721063413 ,7132,1361,1412954408401,2141,7853,84745 41871.
6 0072551122000011023400000122000072000100 Below is a table summarizing COVID-19 variant cases reported to the Tennessee Department of Health. Because sequencing isnot performed by all laboratories, these data are a convenience sample and not indica ve of the true prevalence of learn more about COVID-19 variants, please see the SARS-CoV-2 Variant Classifica ons and Defini ons published by theCDC: h Variants in Circulation TN SARS-CoV-2 Variant Case Summary5 Addi onal data on variant propor ons na onally and by state are available from the CDC at:h #variant-propor ons COVID-19 Critical IndicatorsMay 21, 2022 Vaccine Breakthrough Cases in TN6 This report was produced by the Tennessee Department of Health on May 24, 5|CDC defines COVID-19 Vaccine Breakthrough Cases as a resident with SARS-CoV-2 RNA or an gen detected on a respiratoryspecimen collected 14 days a er comple ng the primary series of an FDA-authorized COVID-19 vaccine.
7 To learn more aboutbreakthrough cases across the US and how they are being reported to the CDC:h RegionChattanooga-Hamilton RegionEast Tennessee RegionJackson-Madison RegionKnoxville-Knox RegionMemphis-Shelby RegionMid-Cumberland RegionNashville-Davidson RegionNortheast RegionSouth-Central RegionSoutheast RegionUpper-Cumberland RegionWest Tennessee RegionGrand Total4,3543463221691343263556141,6694917 2388332227001511410200550170204290093072 3354314221400220800001051010001111010048 2024251171027461918103127866824213921004 3281018001481126311211153941210416010000 0610800 TN SARS-CoV-2 Variant Case Summary Continued5 Below is a table summarizing the COVID-19 variants of interest cases and variants being monitored cases reported to the Tennessee Department of Health.
8 * Hospitaliza ons: Hospitaliza on data is reported from case interviews or via Tennessee Hospital Associa on data. Please note, TDH currentlyconducts more robust ac ve surveillance for hospitalized COVID-19 cases that are vaccinated than for those that are unvaccinated; therefore the datafor hospitaliza ons among the unvaccinated may be more incomplete. We are working to improve the completeness of our hospitaliza on data.** Deaths: Deaths where COVID-19 is a cause or contribu ng factor listed on the death cer ficate. Other cases may s ll be under inves ga Included% of Cases Unvaccinated% of COVID HospitalizationsUnvaccinated*% of COVID DeathsUnvaccinated**May5/2/2021 - 5/29/202196% (13,993/14,518)95% (848/890)June5/30/2021 - 7/3/202193% (6,019/6,503)88% (392/446)July7/4/2021 - 7/31/202186% (28,305/33,001)87% (918/1,051)August8/1/2021 - 8/28/202186% (137,150/158,577)86% (2,226/2,575)September8/29/2021 - 10/2/202184% (143,440/170,001)87% (2,944/3,400)October10/03/2021 - 10/30/202178% (31,122/39,921)81% (930/1,149)November10 - 11/27/202175% (22,910/30,438)77% (586/760)December11/28/2021 - 1/1/202269% (93,446/135,301)81% (721/895)97% (228/236)96% (152/159)88% (184/208)83% (723/869)85% (1,527/1,790)84% (665/795)81% (408/503)82% (527/646)
9 Percentage of Unvaccinated Cases, Hospitalizations, and Deaths:COVID-19 Critical IndicatorsMay 21, 2022 7 Day Rolling Average of COVID-19 Cases by Vaccination Status 7 Day Rolling Average of COVID-19 Hospitalizations by Vaccination StatusThis report was produced by the Tennessee Department of Health on May 24, 6|The plot below shows the 7 day rolling average rate of COVID-19 hospitaliza ons (per 100,000 persons) by vaccina on status. 7 Day Rolling Average of COVID-19 Deaths by Vaccination StatusThe plot below shows the 7 day rolling average rate of COVID-19 deaths (per 100,000 persons) by vaccina on occurringduring this memay not yet bereportedFebruaryMarchAprilMay012 Hospitaliza onsoccuring during this me may not yet bereportedFebruaryMarchAprilMay012 Deaths occurring during this me may not yet be reportedNot Fully VaccinatedFully VaccinatedNot Fully VaccinatedFully VaccinatedNot Fully VaccinatedFully VaccinatedCOVID-19 Critical IndicatorsMay 21, 2022 7 Day Running Average of New Cases in Metropolitan Public Health Regions7 7 Day Running Average of New Cases in Rural Public Health Regions7 This report was produced by the Tennessee Department of Health on May 24, 7|The plot above illustrates the 7 day running average of new COVID-19 cases (based on the date of public report ) for the sixmetropolitan public health regions.
10 The Nashville/Davidson and Memphis/Shelby metropolitan areas have consistently reportedhigher counts of COVID-19 cases compared to the other four metropolitan areas since the outbreak plot above illustrates the 7 day running average of new COVID-19 cases (based on the date of public report ) for the sevenrural public health 1, 21 Jan 1, 22 Feb 1, 22 Mar 1, 22 Apr 1, 22050010001500200025007 Day Average of New CasesBlountville/Sullivan CountyChattanooga/Hamilton CountyJackson/Madison CountyKnoxville/Knox CountyMemphis/Shelby CountyNashville/Davidson CountyDec 1, 21 Jan 1, 22 Feb 1, 22 Mar 1, 22 Apr 1, 220500100015002000250030007 Day Average of New CasesEast Tennessee RegionMid-Cumberland RegionNortheast RegionSouth Central RegionSoutheast RegionUpper Cumberland RegionWest RegionCOVID-19 Critical IndicatorsMay 21, 2022 COVID-19 Active Cluster Monitoring Table9 COVID-19 Confirmed Clusters by Week10 This report was produced by the Tennessee Department of Health on May 24.