Transcription of Nutrition, Physical Activity and Obesity Spain - WHO/Europe
1 nutrition , Physical Activity and Obesity SpainDemOgrAPhic DAtATotal population46 077 000 Median age (years) expectancy at birth (years) female | male | per capita (US$)30 spent on health (%) : WHO Global Health Observatory Data Repository (1).This is one of the 53 country profiles covering developments in nutrition , Physical Activity and Obesity in the WHO European Region. The full set of individual profiles and an overview report including methodology and summary can be downloaded from the WHO Regional Office for Europe website: The country codes refer to the ISO 3166 -1 Alpha-3 country codes. Data ranking for Obesity is intentionally the same as for the overweight data. BMI: body mass : WHO Global Health Observatory Data Repository (1).
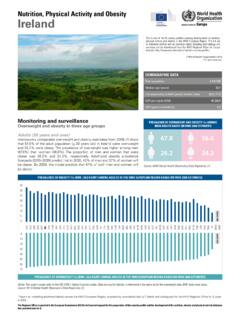
2 Of Overweight AND Obesity (%) AmONg sPANish ADults bAseD ON whO 2008 estimAtes World Health Organization 2013 All rights regional Office is grateful to the european commission (ec) for its financial support for the preparation of this country profile and the development of the nutrition , Obesity and Physical Activity database that provided data for and surveillanceOverweight and Obesity in three age groupsAdults (18/20 years and over)Intercountry comparable overweight and Obesity estimates from 2008 (1) show that of the adult population (> 20 years old) in Spain were overweight and were obese. The prevalence of overweight was higher among men ( ) than women ( ). The proportion of men and women that were obese was and , respectively.
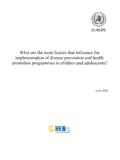
3 According to a nationally representative survey carried out in 2011 2012 among individuals aged 18 years or over, were overweight and were obese (based on self-reported weight and height). Overweight prevalence estimates for men and women were and , respectively. The prevalence of Obesity for men and women was and , respectively (2). It should PrevAleNce Of Obesity (%) (bmi kg/m2) AmONg ADults iN the whO eurOPeAN regiON bAseD ON whO 2008 estimAtesPrevAleNce Of Overweight (%) (bmi kg/m2) AmONg ADults iN the whO eurOPeAN regiON bAseD ON whO 2008 estimAtes35302520151050010203040506070 CZEM LTGBRSVNESPIRLTURHUNISRBIHLT ULUXANDDEURUSSVKPRTCYPPOLSRBISLFINBGRHRV NORLVABLRBELAZEKAZMNEARMALBGEOAUTITAMKDE STGRCUKRSWENLDDNKROUFRAMDACHEUZBKGZTKMTJ KMCOSMRNO DATANO DATA1 Report on modelling adulthood Obesity across the WHO European Region, prepared by consultants (led by T.)
4 Marsh and colleagues) for the WHO Regional Office for Europe in Based on 2007 WHO growth reference. 3 WHO Regional Office for Europe grey literature from 2012 on The country codes refer to the ISO 3166 -1 Alpha-3 country codes. Data were derived from country-specific publications on surveys carried out in this field, not as part of a European-wide survey. Due to different data collection methods of the country-specific surveys, any comparisons between countries must be made with : WHO Regional Office for Europe grey literature from 2012 on fat intakeAccording to the 2007 estimates of the Food and Agriculture Organization of the United Nations (FAO), the adult population in Spain consumed of their total calorie intake from saturated fatty acids (5). According to national data from 2010, the adult population aged 18 64 years in Spain consumed of their total calorie intake from saturated fatty acids (6).
5 It should be taken into account that these latter, national data do not allow for comparability across countries due to sampling and other methodological The country codes refer to the ISO 3166 -1 Alpha-3 country codes. Ranking of data was carried out so that country data at the right-hand side of the graph with values below the FAO recommendation fall within the positive frame of the : FAOSTAT (5).be taken into account that these data do not allow for comparability across countries due to sampling and methodological Obesity prevalence forecasts (2010 2030) predict that in 2020, 27% of men and 19% of women will be obese. By 2030, the model predicts that 36% of men and 21% of women will be Adolescents (10 19 years)In terms of prevalence of overweight and Obesity in adolescents, up to 35% of boys and 24% of girls among 11-year-olds were overweight, according to data from the Health Behaviour in School-aged Children (HBSC) survey (2009/2010).
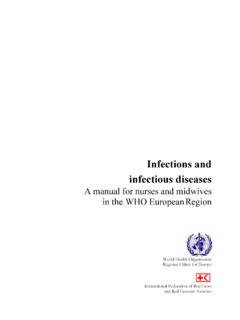
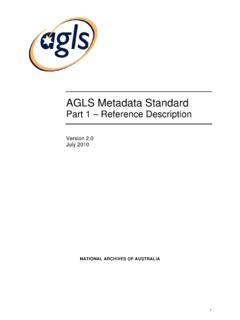
6 2 Among 13-year-olds, the corresponding figures were 30% for boys and 17% for girls, and among 15-year-olds, 23% and 14%, respectively (3). Children (0 9 years)No data are available from the WHO European Childhood Obesity Surveillance Initiative (COSI) 2007/2008 round. Spain , however, joined the second COSI data collection round during the school year 2009/2010. Intercountry data analysis is under way. National analyses of the Spanish COSI data revealed that of children aged 6 9 years were overweight and were obese (4).2 Exclusive breastfeeding until 6 months of ageNationally representative data from 2011 2012 show that the prevalence of exclusive breastfeeding at 6 months of age was in Of eNergy frOm sAturAteD fAtty AciDs (%) AmONg ADults iN the whO eurOPeAN regiON, 20071614121086420 FRABELDNKFINAUTSWENLDGRCLVAHUNDEUSVNIRLL UXGBRITAPRTESPPOLM LTROUESTLT UBGRALBANDARMAZEBLRBIHHRVCYPCZEGEOISLISR KAZKGZMCOMNENORMDARUSSMRSRBSVKCHETJ KMKDTURTKMUKRUZBFAO RECOMMENDATION - max.
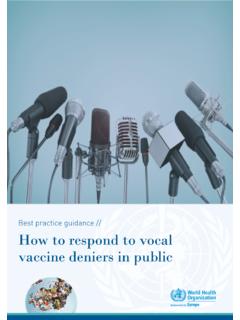
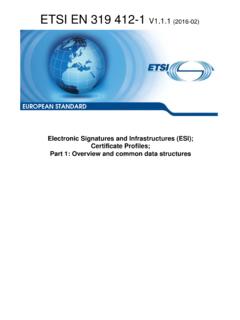
7 10% energyNO DATAPrevAleNce Of Overweight (%) iN sPANish ADOlesceNts(bAseD ON self-rePOrteD DAtA ON height AND weight)11-year-olds13-year-olds15-year-o lds352430172314 Source: Currie et al. (3).PrevAleNce Of exclusive breAstfeeDiNg (%) uNDer Or At 6 mONths Of Age frOm iNDiviDuAl cOuNtry-bAseD surveys, vAriOus yeArs6050403020100 ANDESTFRAISRMCOPOLPRTRUSSMRSVNGRCGBRBGRI TAIRLLUXBELBLRAUTSWEGEOTKMAZENORCYPCHESR BFINROULVABIHCZENLDUKRMNEISLDEUMKDDNKTJ KUZBLT UESPSVKKAZARMM LTHUNALBTURMDAHRVKGZNO NATIONAL DATAU nder 6 months of ageAt 6 months of ageAt 3, 4 or 5 months of agefruit AND vegetAble suPPly (grAms) Per PersON Per DAy iN the whO eurOPeAN regiON, 2009 Fruit and vegetable supplySpain had a fruit and vegetable supply of 635 grams per capita per day, according to 2009 FAO estimates (5).
8 According to national data from 2010, the mean consumption of fruit was 208 grams per day and the mean consumption of vegetables was 193 grams per day for adults (18 64 years) (7). It should be taken into account that the latter consumption data do not allow for comparability across countries due to sampling and other methodological UFINTJ KDEUPOLESTKGZTKMRUSCHEISLHRVUKRFRASWENOR NLDBLRKAZGBRHUNBELSVNCYPROUAUTESPAZEDNKS RBIRLUZBLUXMKDBIHM LTITAISRPRTALBTURGRCARMMNESalt intakeData from 2011 show that salt intake in Spain was grams per day for both men and women (8).TURHUNHRVMKDCZEBGRSVNPRTROUSWEESTESP ITALUXFRACHELT UIRLDNKNORAUTNLDSVKFINGBRISLDEUANDLVABEL ISRPOLCYPALBARMAZEBLRBIHGEOGRCKAZKGZM LTMCOMNEMDARUSSMRSRBTJ KTKMUKRUZBN otes. The country codes refer to the ISO 3166 -1 Alpha-3 country codes.
9 Ranking of data was carried out so that country data at the right-hand side of the graph with values above the WHO/FAO recommendation fall within the positive frame of the : FAOSTAT (5).Notes. The country codes refer to the ISO 3166 -1 Alpha-3 country codes. Data were derived from country-specific publications on surveys carried out in this field, not as part of a European-wide survey. Due to different data collection methods of the country-specific surveys, any comparisons between countries must be made with caution. Ranking of data was carried out so that country data at the right-hand side of the graph with values below the WHO/FAO recommendation fall within the positive frame of the : WHO Regional Office for Europe (8).Iodine statusAccording to the most recent estimates on iodine status, published in 2012, the proportion of the population with an iodine level lower than 100 g/L was (9, 10).
10 Physical inactivityIn Spain , of the population aged 15 years and over were insufficiently active (men and women ), according to estimates generated for 2008 by WHO (1). National data from 2011 2012 show that of the adult population (> 15 years old) were sedentary (men and women ) (2). It should be taken into account that these national data do not allow for comparability across countries due to sampling and methodological and actionsThe table below displays (a) monitoring and evaluation methods of salt intake in Spain ; (b) the stakeholder approach toward salt reduction; and (c) the population approach in terms of labelling and consumer awareness initiatives (8). WHO/FAO RECOMMENDATION - >600 gramsNO DATAsAlt iNtAke (grAms) Per PersON Per DAy fOr ADults iN the whO eurOPeAN regiON frOm iNDiviDuAl cOuNtry-bAseD surveys.