Transcription of NVIDIA GRID vPC Sizing Guide
1 SP-10103-001_v01 | August 2020 NVIDIA grid vPC Sizing Guide Application Sizing Guide NVIDIA grid vPC Sizing Guide SP-10103-001_v01 | ii Document History SP-10103-001_v01 Version Date Authors Description of Change 01 August 13, 2020 AS, EA, SM Initial Release NVIDIA grid vPC Sizing Guide SP-10103-001_v01 | iii Table of Contents Chapter 1. Executive Summary .. 1 About NVIDIA nVector Benchmark .. 2 What is NVIDIA grid vPC? .. 3 Recommended NVIDIA GPUs for NVIDIA grid vPC .. 4 Chapter 2. Testing Methodology .. 6 Single VM Testing .. 6 Test Environment.
2 6 Test Metrics Frame buffer Usage .. 7 GPU Profiler .. 7 Scalability Testing .. 8 Server Utilization Metrics .. 8 User Experience Metrics .. 9 Latency Metrics .. 9 Remoted Frames Metrics .. 9 Image Quality .. 10 Chapter 3. Test Findings .. 11 Single VM Multi-Monitor Resolution Test Results .. 11 High Definition (1920 1080) Displays .. 12 Quad High Definition (2560 1440) Displays .. 12 Dual QHD Monitor Test Results .. 13 Triple QHD Monitor Test Results .. 13 Quad QHD Monitor Test Results .. 14 4K (4096 2160) Displays .. 15 Single 4K Monitor Test Results.
3 15 Dual 4K Monitor Test Results .. 15 5K (5120 2880) Display .. 16 Phase 2: Multi-Monitor Resolution Scalability Test Results .. 17 Server Utilization Metrics .. 18 Reduced CPU and increased VDI density .. 19 nVector User Experience Metrics .. 21 Frame Rate .. 21 Latency Metrics .. 22 Image Quality .. 22 Chapter 4. Deployment Best Practices .. 24 Run a Proof of Concept .. 24 Leverage Management and Monitoring Tools .. 24 NVIDIA grid vPC Sizing Guide SP-10103-001_v01 | iv Understand Your Users .. 25 Use Benchmark Testing .. 25 Understanding the GPU Scheduler.
4 26 Chapter 5. Summary .. 27 Appendix A. Frame Buffer Utilization Master List .. 28 NVIDIA grid vPC Sizing Guide SP-10103-001_v01 | v List of Figures Figure 1-1. Characteristics of NVIDIA s Benchmarking Tool .. 2 Figure 2-1. GPU 8 Figure 2-2. SSIM as Measure of Image Density .. 10 Figure 3-1. Frame Buffer Usage with Dual High Definition Monitors .. 12 Figure 3-2. Frame Buffer Usage with Dual Quad High Definition Monitors .. 13 Figure 3-3. Frame Buffer Usage with Triple Quad High Definition Monitors .. 14 Figure 3-4. 2B vGPU Profile with 4 Monitors Frame Buffer Usage.
5 14 Figure 3-5. nVector KW Workload using 2B Profile Frame Buffer Usage .. 15 Figure 3-6. Increased vGPU Profile to 2B with two Monitors Frame Buffer Usage .. 16 Figure 3-7. Frame Buffer Usage for nVector KW Workload .. 17 Figure 3-8. Intel Xeon Gold 6154 Utilization .. 18 Figure 3-9. Intel Xeon Gold 6140 Utilization .. 19 Figure 3-10. CPU Core Utilization on ESXi Host .. 20 Figure 3-11. CPU Core Utilization on ESXi Host .. 20 Figure 3-12. Frame Rate .. 21 Figure 3-13. End User Latency .. 22 Figure 3-14. Image Quality .. 23 Figure 4-1. Benchmark Testing .. 25 List of Tables Table 1-1.
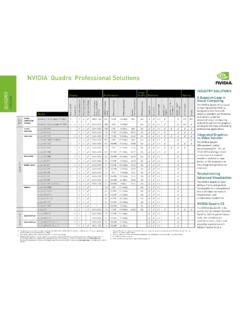
6 Simulating Many Users and Behaviors .. 2 Table 1-2. NVIDIA Virtual PC Feature List .. 3 Table 1-3. Recommended GPUs for Density and Performance .. 4 Table 2-1. Single VM Testing .. 6 Table 2-2. Testing Environment .. 7 Table 3-1. nVector Knowledge Worker Workload Test Results .. 11 Table 3-2. Multi-Monitor High Resolution Test Environment .. 17 Table 4-1. Proof of Concept .. 24 NVIDIA grid vPC Sizing Guide SP-10103-001_v01 | 1 Chapter 1. Executive Summary This specification provides insights into how to leverage NVIDIA grid virtual PC (vPC) for digital knowledge workers.
7 It provides recommendations based on NVIDIA s nVector knowledge worker benchmarking and cover common questions such as the following: Which NVIDIA GPU should I use for my business needs? How do I select the right NVIDIA virtual GPU (vGPU) profile(s) for the types of users I will have? What are the advantages of running NVIDIA grid vPC versus traditional CPU only virtual desktop infrastructure (VDI)? Digital worker ( knowledge worker) workloads will vary per user depending on many factors, including number of applications, the types of applications, file sizes and number of monitors and their resolution.
8 This specification used the NVIDIA nVector as the testing framework for executing a typical knowledge worker workload which simulates application workflow, as well as a tool for capturing real world metrics. Since the number of monitors and their resolution have a direct impact on Sizing , our testing to support this specification explored various screen resolutions and number of monitors. Tests were executed on CPU only VM s as well VM s backed by NVIDIA vGPU. It is recommended that you test your unique workloads to determine the best NVIDIA virtual GPU solution to meet your needs.
9 The most successful customer deployments start with a proof of concept (POC) and are tuned throughout the lifecycle of the deployment. Beginning with a POC enables customers to understand the expectations and behavior of their users and optimize their deployment for the best user density while maintaining required performance levels. Continued maintenance is important because user behavior can change over the course of a project and as the role of an individual changes in the organization. A user that was once a light graphics user might become a heavy graphics user when they change teams or are assigned a different project.
10 Management and monitoring tools enable administrators and IT staff to ensure their deployment is optimized for each user. Executive Summary NVIDIA grid vPC Sizing Guide SP-10103-001_v01 | 2 About NVIDIA nVector Benchmark NVIDIA s performance engineering team developed a methodology and benchmarking tool which simulates, at scale, a digital knowledge worker workflow. This workflow is a good representation of knowledge workers commonly used software applications: Microsoft Word 2016 Microsoft Excel 2016 Microsoft PowerPoint 2016 Google Chrome web browser and video streaming PDF document viewing These applications will perform various functions throughout the test that replicate a task that a real end user would perform.