Transcription of OBESITY AND THE ECONOMICS OF PREVENTION …
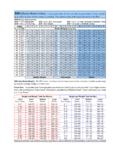
1 1 OBESITY AND THE ECONOMICS OF PREVENTION : FIT NOT FAT KEY FACTS UNITED STATES, UPDATE 2014 A. ADULTS 1. Soaring OBESITY rates make the US the fattest country in the OECD, with of obese adults. Roughly 70% of US adults are overweight, which corresponds to the second highest rate in the OECD (just after Mexico, ). Overweight and OBESITY rates increased steadily since the 1980s in both men and women. The latest data confirm the findings of the OBESITY Update 2012, and show that the prevalence of overweight has grown at a slower pace than previously projected by the OECD, which had foreseen a 1% per year growth until 2020, assuming past long-term trends would continue unabated.
2 More encouraging, the latest data point shows some sign of downturn in the rate of overweight in 2011-12. Figure 1. Trends in the prevalence of overweight (including OBESITY ) in adults, projections and recent estimates, selected OECD countries 25%30%35%40%45%50%55%60%65%70%75%1972197 6198019841988199219962000200420082012201 62020 Rate of overweightYearUSAE nglandSpainFranceCanadaKoreaItaly---Past projectionNew data pointsMexicoAustraliaSwitzerland Source: OECD estimates based on national health surveys. Note: Measured height and weight in Australia, England, Korea, Mexico and USA; self-reported data in other countries.
3 2 2. Social disparities in overweight and OBESITY in the US are smaller than in most OECD countries. Virtually no disparities exist between the different educational levels in 2011-12. Over the 12 years, the probability of OBESITY in men and women adjusted for all other covariates- has increased in all education groups but at a different pace (Figure 2). The degree of social inequality has remained virtually unchanged in recent years. Figure 2. Rate of OBESITY by education level in 1999-2000 and 2011-12, men and women, USA Source: OECD estimates based on the National Health and Nutrition Examination Survey Note: Adjusted probabilities of being OBESITY for men and women aged 40 controlling for marital status, and ethnicity.
4 4. But ethnic disparities do exist in OBESITY rates, especially for women. OBESITY rates are 24 percentage points higher in African-American women and 10 percentage points higher in Mexican-American women than in non-Hispanic white women. Figure 3. OBESITY rates by ethnicity, USA 2011-12 33%32%34%56%42%42%28%27%0%10%20%30%40%50 %60%MenWomenObesity ratesNon-Hispanic WhiteNon-Hispanic BlackMexican AmericanOther ethnicity Source: OECD estimates based on the National Health and Nutrition Examination Survey 2011-12.
5 Note: Adjusted probabilities of being OBESITY for men and women controlling for age, marital status, education level, and socioeconomic status. 3 B. CHILDREN 3. Child overweight rates are among the highest in the OECD, but growth in OBESITY has slowed down. International data collated by the International Association for the Study of OBESITY show that 1 in 3 children is overweight in USA, compared with 23% of boys and 21% of girls, on average, in OECD countries (Figure 3). Figure 4. Measured overweight (including OBESITY ) among children at different ages, 2010 or nearest year Source: International Association for the Study of OBESITY , 2013; B s et al.
6 (2004) for Luxembourg; and KNHANES 2011 for Korea. 4 4. OBESITY and overweight rates among children in the US have become relatively stable in the last ten years (Figure 4). The most recent data show slight declines in OBESITY and overweight rates in boys, while a rebound in OBESITY and overweight rates is observed in girls. Nevertheless, the rates recorded in 2011-12 at the lower bound of previous OECD 2010 projections for boys overweight and for girls OBESITY , and well below for boys OBESITY and for girls overweight.
7 Figure 5. Past and future projected trends in child OBESITY and overweight, age 3-17, USA Source: OECD estimates based on the National Health and Nutrition Examination Survey. Release: 27 May 2014. For more information, please contact: or