Transcription of Obesity Statistics By Carl Baker
1 | | | @commonslibrary BRIEFING PAPER Number 3336, 6 August 2019 Obesity Statistics By carl Baker Inside: 1. Obesity among adults, England 2. Obesity in children, England 3. Obesity in Wales, Scotland and Northern Ireland 4. Bariatric surgery 5. International comparisons Number 3336, 6 August 2019 2 Contents Summary Graphic 3 1. Obesity among adults, England 4 Trends over time 4 Age and gender differences 5 Other inequalities 6 Variation in different parts of England 7 Map of excess weight among adults 8 2. Obesity in children, England 9 Map of Obesity among 4-5 year olds 11 Map of Obesity among 10-11 year olds 12 Childhood Obesity and deprivation 13 3. Obesity in Wales, Scotland and Northern Ireland 14 Adult Obesity in Wales 14 Child Obesity in Wales 15 Adult Obesity in Scotland 15 Child Obesity in Scotland 16 Adult Obesity in Northern Ireland 16 Child Obesity in Northern Ireland 17 4.
2 Bariatric surgery 17 5. International comparisons 18 Cover image attributed to Ben Watkin. Licensed by CC-BY-NC Image modified. Obesity in England: summaryIn England, men are more likely to be have a body mass index measurement above normal than briefing also contains information on: adult and child Obesity rates in Scotland, Wales, and Northern Ireland; bariatric surgery for Obesity ; and international levels are highest among ages levels have increased from 15% to 29% since in ten children is obese by age 5, rising to one in five by age children are more likely to be obese, and the gap has Number 3336, 6 August 2019 4 Measures of Obesity The most widely used measure of Obesity is the Body Mass Index (BMI), defined as weight divided by the square of height (kg/m ). A person is classified as obese if their BMI is 30 or higher. A BMI of 40 or more is often known as morbid Obesity .
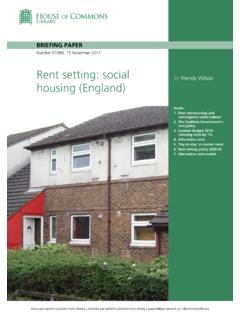
3 The full range of classifications is as follows. This measure is not always definitive, and sometimes other measures are These include waist circumference and the waist-hip ratio (defined as the waist circumference divided by the hip circumference which provides an indication of the distribution of fat on the body). 1. Obesity among adults, England The Health Survey for England measures a representative sample of adults aged 16+ and provides estimates of Obesity levels in the country. In the 2017 survey, it found that of adults in England are obese and a further are overweight, making a total of who are either overweight or Of obese adults, around one in eight are morbidly obese ( of all adults). Men are more likely than women to be overweight or obese ( of men compared with of women). Trends over time Between 2006 and 2016, the proportion of adults who were either overweight or obese changed little.
4 In 2017, however, the survey returned the highest recorded level of Obesity at Some annual fluctuation is to be expected since this data comes from a survey. 1 , Obesity 2 NHS Digital, Health Survey for England, 2017 Out of every 1,000 adults in which287 are obese36 are morbidly obese356 are overweight341 are of normal weight16 are underweightClassificationBMIU nderweight< - - : Class - : Class - : Class +5 Obesity Statistics Looking further back, there has been a clear increase in Obesity levels since 1993, from to Correspondingly, the percentage of adults who are either overweight or obese has risen from to Health Risks of Obesity Obesity increases the risk of other health conditions, including: Joint problems Lower back pain Hypertension (high blood pressure) Coronary heart disease and stroke Deep vein thrombosis Type 2 diabetes Endometrial, breast and colon cancer Stress incontinence Menstrual abnormalities Respiratory problems More information is available from the NHS website.
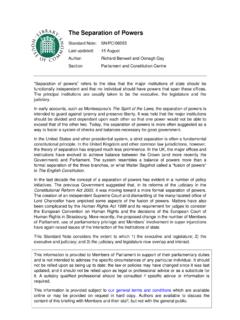
5 Age and gender differences The age group most likely to be overweight or obese is age 66-74. Prevalence of overweight and Obesity is above 70% among all age groups from 45 upwards. The adult age group least likely to be obese is 16-24 year olds, with 57% at normal weight and only 37% overweight or obese, as the chart below shows. 3 NHS Digital, Health Survey for England, 2017 Adult Obesity in England has risen from 15% in 1993 to 29% in 2017. 0%20%40%60%80%19931997200120052009201320 17 Overweight but not obeseObeseOverweight or obes e Number 3336, 6 August 2019 6 As noted above, men are more likely than women to be overweight or obese. However, Obesity levels among women ( ) are slightly above those of men ( ) These proportions vary by age, as the collection of charts below shows.
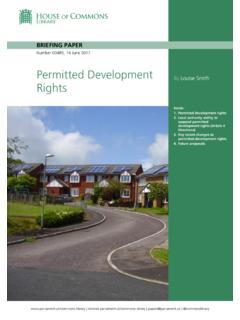
6 16-24 is the only age group where women are more likely to be overweight or obese than men. Other inequalities The charts below show data from the Active Lives Survey as published via Public Health England s data The results show how 4 Active Lives Survey data 2017/18, extracted from Public Health England Profiles Obesity levels are over 30% among those aged 45 and over57%41%33%27%27%24%27%22%34%37%36%39% 43%41%15%23%29%36%34%33%31%16-2425-3435- 4445-5455-6465-7475+Ob es eOverweightNormalUnderweightIn most age groups, men are more likely than women to be overweight or obese0%20%40%60%80%100%MenWom enAge 16-240%20%40%60%80%100%MenWom enAge 25-340%20%40%60%80%100%MenWom enAge 35-440%20%40%60%80%100%MenWom enAge 45-540%20%40%60%80%100%MenWom enAge 55-640%20%40%60%80%100%MenWom enAge 65-740%20%40%60%80%100%MenWom enAge 75-84 ObeseOverweightNormalUnderweight7 Obesity Statistics excess weight in adults (the percentage either overweight or obese) is not equally distributed among social groups: In the most deprived areas in England, prevalence of excess weight is 11 percentage points higher than the least deprived areas Among people with disabilities, excess weight is 11 percentage points higher than among those without disabilities.
7 People with Black ethnicity have the highest rates of excess weight, and White British people have higher rates of excess weight than other ethnic groups except Black. Among people with no qualifications, rates of excess weight are 12 percentage points higher than among people with level 4 qualifications or higher ( a degree). Variation in different parts of England The Active Lives Survey allows us to estimate variation in the proportion of adults that are overweight or obese in different local The most recent available data covers surveys from 2017/18, and shows that levels of excess weight are estimated to be highest in the North East and the West Midlands. The map on the following page and the tables that follow show data for each local authority in England. Because of the small sample size for these local authority estimates there is some uncertainty around the exact levels of overweight and Obesity .
8 For instance, the central estimate for Hyndburn is , but the nature of the survey means that we can only say with relative certainty that the value is between and So we do not know for sure that Hyndburn has the highest rates. But we can be fairly certain that Doncaster s rates are higher than South Somerset s, which are estimated to be between and 5 Active Lives Survey data 2017/18, extracted from Public Health England Profiles DeprivationDisability% overweight or obeseEthnicityQualifications67%56%Mos t d ep rivedtent hLeast deprivedtent h73%63%59%58%58%57%35%Blac kWhi te BritishMixedOt herWhi te Oth erA sia disabled71%69%66%63%59%66%No qualificationLevel 1 Level 2 Level 3 Level 4 +Ot herOverweight & Obesity ratesOverweight & Obesity ratesOn this map, areas are approximately scaled in size according to theirpopulations: each small hexagon represents a population of around 8,000people.
9 Areas are grouped by traditional counties and other recognisable areas- these groups include unitary authorities and don't all reflect current localgovernment structures. Lines between hexagons show local authorityboundaries. Extra labels are provided for large towns & cities to help you locateparticular places ( 'Sou.' = Southend).On traditional maps (such as the inset, right), sparsely-populated rural areas arevisually over-represented since they appear much larger than densely-populated urban areas. Since rural and urban areas can be very different toone another, this means that traditional maps don't always give a full picture ofthe data when viewed on their weight in England: adultsExcess weight in England: adultsData source: Active Lives Survey via Public Health EnglandHow to read this population-based mapLowestBelow averageSimilar to averageAbove averageHighestStandard mapOn the inset map above, blackborders match the county groupingsused on the main mapMap scale (approx)8,000100,000500,000people9 Obesity Statistics Active Lives Survey data 2017/18, extracted from Public Health England Profiles 2.
10 Obesity in children, England The National Child Measurement Programme (NCMP) shows that of reception age children in England (age 4-5) were obese in 2017/18, with a further overweight. These proportions were higher among year 6 children (age 10-11), with being obese and overweight. Note that these categories are not directly comparable to those used for adults, since measuring BMI and Obesity for children is more complex than for adults. In the NCMP, obese is defined as having a BMI in the 95th percentile or higher of the British 1990 growth reference. In both age groups, boys are slightly more likely than girls to be obese. This difference is one percentage point at age 4-5, but rises to almost four percentage points by age 10-11. Adult excess weight by local authority, 2017/18 Local AuthorityMain estimateLow EstimateHigh EstimateLocal AuthorityMain estimateLow EstimateHigh EstimateHyndburn, , of , , Chase, upon , Albans, , and , Helens, and and percentage overweight or obeseHigh percentage overweight or obeseOf every thousand 10 & 11 year olds in every thousand 4 & 5 year olds in are obese95 are obese142 are overweight128 are overweight643 are of normal weight766 are of normal weight14 are underweight10 are underweight Number 3336, 6 August 2019 10 The maps on the following two pages analyse the NCMP data by local authority.