Transcription of OCR AS Mathematics B (MEI) H630/02 combined SAM
1 OCR 2018 H630/02 Turn over AS Level Mathematics B (MEI) H630/02 pure Mathematics and statistics Sample question Paper Version 2 Date Morning/Afternoon Time allowed: 1 hour 30 minutes You must have: Printed Answer Booklet You may use: a scientific or graphical calculator * 0 0 0 0 0 0 * INSTRUCTIONS Use black ink. HB pencil may be used for graphs and diagrams only. Complete the boxes provided on the Printed Answer Booklet with your name, centre number and candidate number. Answer all the questions. Write your answer to each question in the space provided in the Printed Answer Booklet. Additional paper may be used if necessary but you must clearly show your candidate number, centre number and question number(s).
2 Do not write in the bar codes. You are permitted to use a scientific or graphical calculator in this paper. Final answers should be given to a degree of accuracy appropriate to the context. INFORMATION The total number of marks for this paper is 70. The marks for each question are shown in brackets [ ]. You are advised that an answer may receive no marks unless you show sufficient detail of the working to indicate that a correct method is used. You should communicate your method with correct reasoning. The Printed Answer Booklet consists of 12 pages. The question Paper consists of 12 pages. Specimen2 OCR 2018 H630/02 Turn over Formulae AS level Mathematics B (MEI) (H630) Binomial series 12 212()C C C ()nnnnnnnn r rnra baa bababbn , where !
3 CC!()!nrnrnnrr n r 2(1)(1)(1)(1)1 1, 2!!nrn nn nn rxnxxxxnr Differentiation from first principles 0f () f ( )f ( )limhx hxxh Sample variance 2222221 where ()1ixxxxiiixsSSxxxxnxnn Standard deviation, variances The binomial distribution If~ B( , )Xn pthen()Cnr n rrP Xrp q where 1qp Mean of X is np Kinematics Motion in a straight line vu at 212s utat 12su v t 222vuas 212s vtat Specimen3 OCR 2018 H630/02 Turn over Answer all the questions 1 Find221dxxx . [3] 2 (a) Express 332loglogxa as a single logarithm. [1] (b) Given that332loglog2xa , express x in terms of a.
4 [3] 3 Show that the area of the region bounded by the curve 323yx , the lines 1x , 3x and the x-axis is 6 2 3 . [5] Specimen4 OCR 2018 H630/02 Turn over 4 There are four human blood groups; these are called O, A, B and AB. Each person has one of these blood groups. The table below shows the distribution of blood groups in a large country. Blood group Proportion of population O 49% A 38% B 10% AB 3% Two people are selected at random from this country. (a) Find the probability that at least one of these two people has blood group O. [2] (b) Find the probability that each of these two people has a different blood group.
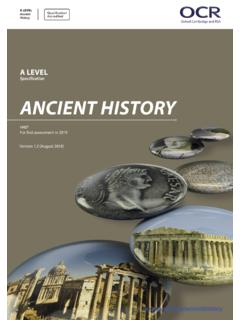
5 [3] 5 A triangular field has sides of length 100 m, 120 m and 135 m. (a) Find the area of the field. [5] (b) Explain why it would not be reasonable to expect your answer in (a) to be accurate to the nearest square metre. [1] Specimen5 OCR 2018 H630/02 Turn over 6 (a) The graph of 23siny for 0360 is shown in Fig. 6. On the copy of Fig. 6 in the Printed Answer Booklet, sketch the graph of 2 cosy for 0360 . [2] Fig.
6 6 (b) In this question you must show detailed reasoning. Determine the values of , 0360 , for which the two graphs cross. [6] 360 180 y 3 2 1 0 -1 -2 -3 Specimen6 OCR 2018 H630/02 Turn over 7 A farmer has 200 apple trees. She is investigating the masses of the crops of apples from individual trees. She decides to select a sample of these trees and find the mass of the crop for each tree. (a) Explain how she can select a random sample of 10 different trees from the 200 trees. [2] The masses of the crops from the 10 trees, measured in kg, are recorded as follows. (b) For these data find the mean, the sample standard deviation. [2] (c) Show that there is one outlier at the upper end of the data.
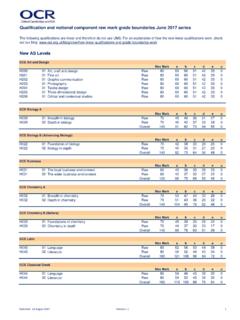
7 How should the farmer decide whether to use this outlier in any further analysis of the data? [3] Specimen7 OCR 2018 H630/02 Turn over 8 In an experiment, the temperature of a hot liquid is measured every minute. The difference between the temperature of the hot liquid and room temperature is D C at time t minutes. Fig. 8 shows the experimental data. Fig. 8 It is thought that the model might fit the data. (a) Write down the derivative of . [1] (b) Explain how you know that is a decreasing function of t. [1] (c) Calculate the value of when (i) 0t , [1] (ii) 20t.
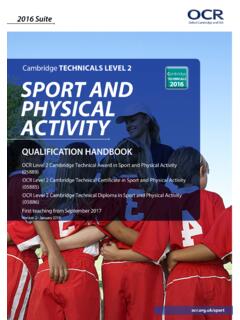
8 [1] (d) Using your answers to parts (b) and (c), discuss how well the model fits the data. [3] 0 2 4 6 8 10 12 14 16 18 20 t D 70 60 50 40 30 20 10 0 Specimen8 OCR 2018 H630/02 9 Fig. shows box and whisker diagrams which summarise the birth rates per 1000 people for all the countries in three of the regions as given in the pre-release data set. The diagrams were drawn as part of an investigation comparing birth rates in different regions of the world.
9 Fig. (a) Discuss the distributions of birth rates in these regions of the world. Make three different statements. You should refer to both information from the box and whisker diagrams and your knowledge of the large data set. [3] (b) The birth rates for all the countries in Australasia are shown below. Country Birth rate per 1000 Australia New Zealand Papua New Guinea (i) Explain why the calculation below is not a correct method for finding the birth rate per 1000 for Australasia as a whole. [1] (ii) Without doing any calculations, explain whether the birth rate per 1000 for Australasia as a whole is higher or lower than [1] 0 10 20 30 40 50 Birth rate per 1000 Africa (Sub-Saharan) East and South East Asia Caribbean Specimen OCR 2018 H630/02 Turn over The scatter diagram in Fig.
10 Shows birth rate per 1000 and physicians/1000 population for all the countries in the pre-release data set. Fig. (c) Describe the correlation in the scatter diagram. [1] (d) Discuss briefly whether the scatter diagram shows that high birth rates would be reduced by increasing the number of physicians in a country. [1] 01020304050012345678910 Birth rate per 1000 Physicians/1000 population Specimen10 OCR 2018 H630/02 Turn over 10 A company operates trains. The company claims that 92% of its trains arrive on time. You should assume that in a random sample of trains, they arrive on time independently of each other.