Transcription of OCTO BER 2013 | VOLUME 8 - World Bank Group
1 OCTOBER 2013 | VOLUME 8An analysis of issues shaping africa s economic futureu Economic prospects for Sub-Saharan africa remain strong, but growth is vulnerable to a sharp decline in commodity pricesu The region s progress on reducing poverty has been slow, hindered by high inequalityu Faster reduction in poverty will require growth with equityAFRICA S PULSE TEAM:Punam Chuhan-Pole (Team Leader),Luc Christiaensen, Allen Dennis,Gerard Kambou, Manka Angwafo,Mapi Buitano, Vijdan Korman,Camila Galindo Pardo, Aly SanohWith contributions fromFrancisco Ferreira, Delfin Go, Maryla Maliszewska, Israel Osorio-Rodarte This document was produced bythe Office of the Chief Economistfor the africa regionAFRICA S PULSE>2 Summary u Global economic activity remains subdued, and despite signs of strengthening in high-income countries, signi cant downside risks Economic activity remains strong in much of Sub-Saharan africa , underpinned by robust domestic The economic outlook for the region is positive, although the region is vulnerable to both a sharp decline in commodity prices and the fragility of the global More than a decade of growth has helped to lower poverty.
2 But the twin goals of ending extreme poverty and boosting shared prosperity call for a sharp ramping up of e A low growth elasticity of poverty means that growth alone will not su ce to rapidly reduce poverty in the region. Accelerating africa s poverty reduction will also require more inclusive growth processes and tackling I: Recent Trends and Prospects A. RECENT DEVELOPMENTS IN THE GLOBAL ECONOMYu Global growth remains weak, but advanced economies are making progress in rebuilding their economies; growth in developing countries remains GDP growth in Sub-Saharan africa is projected to strengthen to percent in 2013, rising to percent in 2014 and percent in Growth will be supported by a continuation of strong domestic demand and higher production in the mineral resources, agriculture, and service years after the financial crisis, global economic growth has yet to catch up to precrisis levels, as high-income countries continue to see subpar and uneven economic performance.
3 These countries saw a slowdown in GDP growth in 2012, as economic activity contracted in the Euro Area, pulled down by weak market confidence and banking sector and fiscal restructuring; growth was a modest percent in the United States, weighed down by uncertainty in fiscal policy; and the Japanese economy grew by percent, amid uncertainty over medium-term scal has strengthened in high-income countries in 2013, re ecting ongoing progress in the rebuilding of these economies. On the demand side, aggressive monetary and scal stimulus measures africa S PULSE>3in Japan, an extremely accommodative monetary policy stance in the United States, and the European Central bank s commitment to easy monetary policy are supporting growth. GDP growth in high-income economies accelerated to an annualized pace of percent in Q2 2013 from percent in the previous quarter, which represents the strongest high-income country GDP growth in nearly two years.
4 After contracting at an annualized pace of percent in Q1, growth in the Euro Area rebounded by percent in the second quarter as the recession there bottomed. The United States also saw a sharp uptick in economic activity of percent annualized rate in the second quarter, after a weak rst quarter, while Japan continued to post solid gains in Q2, albeit at a slower pace. Initial data releases for Q3 suggest that the strengthening of economic activity in high-income countries is likely to be , developing-country growth is around trend, with variation across countries. GDP expanded by percent in 2012. After slowing to percent in Q1 2013, GDP growth picked up to percent in the second quarter. Among large developing countries, economic activity in Q2 2013 strengthened in China ( percent). Overall, however, the Chinese economy has been on a lower growth path since 2011 as the country slowly transitions from an investment-driven to a more consumer-based economy.
5 Second quarter eeconomic activity also strengthened in Brazil ( percent), Indonesia ( percent), and Turkey ( percent). In contrast, GDP growth in India decelerated to a two-year low of percent as concerns over persistently high inflation and large fiscal and current account imbalances weakened domestic demand. July Industrial production data indicated a strengthening of economic activity in China, but weakening in Brazil and India. Purchasing Manager Indicator releases for August suggest that the divergent pattern of growth observed across developing economies in Q2 is likely to continue into regarding the tapering of quantitative easing (QE) have driven Treasuries up by over 100 basis points since early May, sparking a slowdown of capital ows to developing countries. In June, gross capital ows to developing countries fell by some 50 percent, as investors adjusted their portfolios from developing-country assets to the increasingly more attractive Treasury bonds.
6 This portfolio adjustment continued through July and August. As a consequence of these out ows and of structural challenges in some economies, sharp currency depreciations occurred in a number of large developing countries that bene ted from earlier periods of monetary policy easing notably, Brazil, India, Indonesia, and South africa . Nonetheless, in September, the pressure on developing-country currencies eased in line with the Federal Reserve s (Fed s) announcement to continue its QE projections indicate a strengthening trend in global economic activity between 2013 and 2015. Global GDP is expected to expand by a still subdued percent in 2013, and strengthen to about percent and percent in 2014 and 2015, respectively. Yet downside risks remain. While over the short term the Fed s recent announcement buys time for developing countries with large imbalances and domestic structural problems, the longer-term challenges still remain.
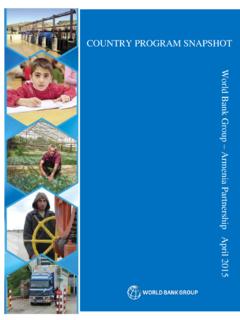
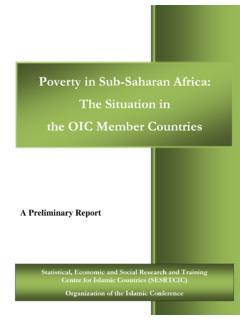
7 Another notable risk is the ongoing debt ceiling discussions. If the brinkmanship associated with these talks escalates, it could increase business uncertainty and weigh down on GDP growth both in the United States and S PULSE>4B. RECENT ECONOMIC DEVELOPMENTS IN SUB-SAHARAN AFRICAE conomic activity remains strong in much of Sub-Saharan africa , with the pace of GDP growth in the region projected to pick up in 2013. After an increase of percent in 2012,1 GDP growth in Sub-Saharan africa is projected to strengthen to percent in 2013 (Figure 1). In 2012, GDP growth varied widely across the region from a contraction in output in Sudan, due to political developments, to double-digit growth in Niger and Sierra Leone, supported by the coming onstream of new mineral production in those countries. Median growth for the region was 5 percent, with about a third of countries in the region growing at 6 percent and above.
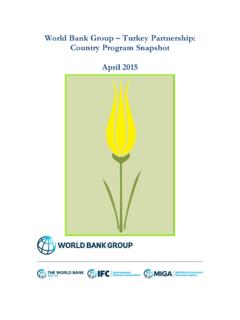
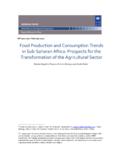
8 Many of these countries have seen sustained high growth for several years. As in recent years, a number of African countries will continue to be among the fastest-growing countries in the World . There is some variation in output performance across country groups (Figure 2). Resource-rich countries have higher average growth rates than nonresource-rich countries, similar to the pattern observed in the pre-crisis period (2003-08). Growth for both groups remains below pre-crisis levels. Within the resource-rich country Group , the gap in growth between oil and nonoil countries has narrowed. Indeed, the nonoil resource-rich countries are averaging growth rates slightly above pre-crisis levels. Within the nonresource-rich country Group , there are several countries that have achieved sustained high growth rates for over a decade, such as Ethiopia, Mozambique, and Rwanda.
9 Among countries where growth is lagging pre-crisis levels is South africa . Weak growth in major trading partners (especially Europe), labor unrest and mining strikes, burdensome regulations, and infrastructure gaps have held back the country s growth, which averaged 3 percent in 2010-12 compared to percent in growth continues to be supported by robust domestic demand. Domestic demand has grown faster than GDP, thanks to strong growth in both investment in the productive capacity of the region s economies and household consumption. The expansion of commodity exports 1 Excluding South Sudan, whose economy contracted by more than 50 percent as con icts with Sudan crippled its oil industry. Real GDP growth in Sub-Saharan africa strengthened in 2013 Resource-rich countries have higher average growth rates than nonresource-rich countriesFIGURE 1: Real GDP growthFIGURE 2: Real GDP growth in Sub-Saharan africa , by country groupsSource: World : World Nonresource-rich Resource-rich nonoil Reource-rich oil -1 0 1 2 3 4 5 6 7 8 9 2001 2002 2003 2004 2005 2006 2007 2008 2009 2010 2011 2012 2013 0 1 2 3 4 5 6 7 8 Developing countries excl.
10 China Sub-Saharan africa excl S. africa Sub-Saharan africa Percent 2005 2006 2007 2008 2009 2010 2011 2012 2013 africa S PULSE>5remains an important part of the region s growth dynamics, although the contribution of net exports exports minus imports to GDP growth is overall negative (Figure 3). The region s growth is underpinned by strong private and public investment. Gross fixed capital formation in Sub-Saharan africa has steadily increased from about percent of GDP in 2000 to about percent in 2011. The pickup in investment has not only contributed to growth directly, but has also helped boost the productive capacity of the region s economy. Foreign direct investment (FDI) flows to the region have steadily increased in recent years, and are projected to rise by 24 percent to about $40 billion in 2013. These flows accounted for over 50 percent of total capital flows to the region in 2010-12 (Figure 4).