Transcription of OECD System of Composite Leading Indicators
1 April 2012 OECD System OF Composite Leading Indicators 2 TABLE OF CONTENTS This methodology guideline has been prepared by Gyorgy Gyomai and Emmanuelle Guidetti. We would like to thank Mr. N. Ahmad, Mr. D. Brackfield, Mr. R. Nilsson and Ms. E. Tosetto for their precious help. OECD S Composite Leading Indicators (CLI) .. 3 PURPOSE .. 3 PRE-SELECTION .. 4 Reference series .. 4 Selection of the component 5 FILTERING .. 6 Periodicity .. 6 Seasonal adjustment .. 6 Outlier detection .. 6 Cycle identification (de-trending, smoothing and turning points detection).
2 6 Normalisation .. 7 EVALUATION .. 7 Length and consistency of the lead .. 8 Cyclical conformity between selected Indicators and reference series .. 8 Missing or extra cycles .. 8 Performance .. 8 AGGREGATION .. 8 8 Lag-shifting and inversion .. 9 Aggregation .. 9 PRESENTATION .. 9 The amplitude adjusted CLI vs. the de-trended reference series .. 9 The trend restored CLI vs. the original reference series .. 10 The 12-month rate of change of the CLI vs. similar reference series .. 11 ANNEX A CYCLES EXTRACTION (DE-TRENDING AND SMOOTHING).
3 13 Phase Average Trend (PAT) Method .. 14 Hodrick-Prescott (HP) Filter .. 15 Christiano-Fidgerald (CF) filter .. 16 ANNEX B TURNING POINTS DETECTION .. 17 18 3 OECD S Composite Leading I NDICATORS (CLI) PURPOSE The OECD System of Composite Leading Indicators was developed in the 1970 s to give early signals of turning points of economic activity. This information is of prime importance for economists, businesses and policy makers to enable timely analysis of the current and short-term economic situation.
4 OECD CLIs are constructed to predict cycles in a reference series chosen as a proxy for economic activity. Fluctuations in economic activity are measured as the variation in economic output relative to its long term potential. The difference between potential and observed output is often referred to as the output gap, and the fluctuation in the output gap as the business cycle. The output gap is not however observable directly, indeed, this is estimated as part of the overall CLI production process.
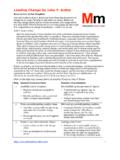
5 The chart below presents the CLI and the estimated business cycle for the OECD area. The two series show strong co-movements, with the turning points of the CLI consistently preceding those of the business cycle. OECD area Composite Leading indicator (CLI) and economic activity (long-term trend = 100) OECD economic activity above the long-term trend OECD economic activity below the long-term trend OECD CLI 95 96 97 98 99 100 101 102 103 95 96 97 98 99 100 101 102 103 1981 1983 1985 1987 1989 1991 1993 1995 1997 1999 2001 2003 2005 2007 2009 2011 4 The figure b elow presents the steps of the OECD CLI selection and production process.
6 The pre-selection and evaluation steps are only processed during the selection of the component/reference series and related factors (filtering procedures and aggregation parameters) used in producing estimates of the CLI. Once these various factors and series have been selected the CLI specification is fixed until they are next reviewed, which occurs periodically to ensure the CLI retains its relevance. Component series, for example, may no longer be appropriate for CLI purposes, either for economic or statistical reasons ( their timeliness may lengthen, and, indeed, in some cases their production may be suspended altogether).
7 In this context it is important to note that changes to these factors and series are also used to recalculate historical estimates of the CLI. The following sections provide a more detailed description of the various steps highlighted above. PRE-SELECTION Reference series OECD CLIs are constructed from economic time series that have similar cyclical fluctuations to those of the business cycle but, and importantly, which precede those of the business cycle. GDP is the obvious choice in this context but official estimates are typically only available on a quarterly basis, whereas the CLI is a monthly statistic.
8 Until March 2012 therefore, the OECD System of Composite Leading Indicators has used the index of industrial production (IIP) as a reference series, which is available on a monthly basis and has also, historically at least, displayed strong co-movements with GDP. In March 2012 however the OECD has investigated whether methods could be applied to generate monthly estimates of GDP based on the official quarterly estimates. This investigation has demonstrated that it is feasible to do so, whilst also continuing to provide high quality results.
9 From April 2012 therefore the OECD has switched to using GDP as the reference, ceasing to rely on the IIP as an intermediate target. Pre-selection Reference series Components series Filtering Periodicity Seasonal adjustment Outlier detection Cycle identification Normalisation Evaluation Length of the lead Cyclical conformity Extra/missing cycles Performance Presentation Amplitude adjusted Trend restored 12-month rate of change Aggregation Weighting Lag-shifting & inversion Aggregation 5 Selection of the component series The selection process considers a wide range of short-term indicators1 Economic relevance.
10 Component series are selected for inclusion in the CLI System on the basis of the following criteria: Economic significance: the observation of a Leading relationship between a potential components series and the reference series is not in itself sufficient an economic justification for the relationship is also needed before the potential component series can be accepted as an indicator . Breadth of coverage: series with a broad coverage of economic activity are preferred to narrowly-defined series.