Transcription of Offshore Safety Statistics Bulletin 2011/12
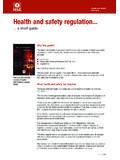
1 Offshore Safety Statistics Bulletin 2011 /12. Fatal and major injuries to Offshore workers Figure 1: Fatal and major injuries 1998/1999 2011 /12p 80. 70. Number of Injuries 60. 50. 40 Fatal 30 Major 20. 10. 0. 2p 20 09. 20 10. 20 /11. 20 06. 20 07. 20 08. 20 02. 20 03. 20 04. 20 05. 19 99. 20 00. 20 01. /. /. /. /. /. /. /. /. /. /. /. /. /1. 10. 06. 07. 08. 09. 03. 04. 05. 98. 99. 00. 01. 02. 11. 19. Figure 2: Combined fatal and major injury rate 1998/1999 2011 /12p 350. 300. Injury rate (per 100,000 workers). 250. 200. 150. 100. 50. 0. Based on provisional figures for 2011 /12: There were 36 major injuries reported during the period, a reduction of six compared to 2010/11 and compares to an average of 41 major injuries over each of the previous five years. There were an estimated 29,058 Offshore workers in 2011 /12, an increase of 5% on the 2010/11 estimate of 27,600 workers.
2 These figures were obtained from an industry-based data source 1 . The combined fatal and major injury rate fell to per 100,000 workers in 2011 /12. compared to in 2010/11, the second lowest rate over the last 10 years (the lowest in 2008 being ). The five-year average prior to 11/12 is Two fatalities occurred in 2011 /12, the first fatalities on Offshore installations since 2006/07. The first occurred in Q1, due to a fall from height during a work shift. The second, a fatality during a diving operation which was reported as a recordable fatality in Q3, should be considered as still provisional with investigations continuing. Types of accident Based on provisional figures for 2011 /2012: The main causes of major injuries were related to slips/trips/falls (17), being trapped or struck by moving objects (7), or injuries associated with lifts/pulls/pushes/handling of loads (7), accounting for 86% of the total.
3 17 major injuries were to the lower limb 2 and 16 to the upper limb/finger/wrist 23 major injuries (64%) were due to fracture. 3. Over-3-day injuries to Offshore workers Figure 3: Over 3-day injuries 1998/1999 2011 /2012p 300. 250. Number of Injuries 200. 150. 100. 50. 0. 9. 20 0 0. 20 0 1. 20 2. 20 0 3. 20 0 4. 20 5. 20 0 6. 20 0 7. 20 8. 20 0 9. 20 1 0. 20 /11. 2p /9. /0. /0. /0. /. /. /. /. /. /. /. /. /1. 98. 99. 00. 01. 02. 03. 04. 05. 06. 07. 08. 09. 10. 11. 19. 19. 1. Provisional data extracted from Vantage system via StepChange in Safety . 2. Lower limb includes ankle, foot, toes and rest of lower limb. 3. Fractures to fingers, thumbs or toes are classed as over-3-day injuries and not as major injuries unless hospitalised over 24 hrs. Figure 4: Over 3-day injury rate 1998/1999 2011 /2012p Injury rate per 100,000 workers 1200.
4 1000. 800. 600. 400. 200. 0. 2p 20 6. 20 9. 20 /11. 20 0. 20 3. 20 4. 20 5. 20 7. 20 8. 19 9. 20 1. 20 0. 20 2. /0. /0. /0. /0. /1. /0. /0. /0. /9. /0. /0. /0. /1. 05. 06. 07. 08. 09. 10. 02. 03. 04. 98. 99. 00. 01. 11. 19. The number of reported over-3-day injuries has reduced this year by 11 to 95 ( fall). and continues the downward trend since 2006/07. Based on the workforce figure of 29,058 workers, the over-3-day injury rate per 100,000. workers ( ) for 2011 /12 shows a fall on that recorded for 2010/11 (383) and is a new low. Types of accident Based on provisional figures for 2011 /2012: Slips, trips and falls, accounted for approx. 32% of over-3-day injuries whilst injuries related to striking or being struck or trapped account for 36%. Lifting operations, handling of plant, push/pull activities and injuries from body movements accounted for approx.
5 22%;. 43 over-3-day injuries (45%) resulted in injury to the upper limb 4 ;. 31% of injuries were to parts of the foot and lower limbs and 18% to the back, neck and torso area. Incidences of ill health to workers Offshore The total number of cases of Offshore ill health reported was 14, an increase of 6 on the previous year. The diseases reported included 6 incidents of chickenpox and 1 case of scarlet fever. Occupational health conditions involved 4 cases of decompression illness and 3 cases of hand-arm vibration. 4. Upper limb includes finger/thumbs, hand, wrist and rest of upper limb. Dangerous occurrences Offshore Figure 5: Dangerous cccurrences 1997/1998 2011 /2012p 900. 800. 700. No. of Incidents 600. 500. 400. 300. 200. 100. 0. 1. 0. p 9. 1. 2. 3. 4. 5. 6. 7. 8. 0. 9. 8. /1.
6 /1. /0. /0. /0. /0. /0. /0. /0. /0. /0. /0. /9. /9. 2. /1. 10. 09. 08. 00. 01. 02. 03. 04. 05. 06. 07. 99. 98. 97. 11. 20. 20. 20. 20. 20. 20. 20. 20. 20. 20. 20. 19. 19. 19. 20. Based on provisional figures for 2011 /2012: 425 dangerous occurrences (including well incidents) were reported. Main types of dangerous occurrences reported were failure of equipment Offshore ( ), hydrocarbon releases ( ), well-related incidents ( ) and events of fire Offshore ( ). Hydrocarbon Releases (HCRs) 5. Figure 6: Offshore hydrocarbon releases 2002/2003 2011 /2012p 200. 180. 160. 140. Releases 120. 100. 80. 60. 40. 20. 0. 2p 3. 8. 9. 0. 1. 4. 5. 6. 7. /0. /0. /1. /1. /0. /0. /0. /0. /0. /1. 10. 02. 03. 04. 05. 08. 09. 06. 07. 11. 20. 20. 20. 20. 20. 20. 20. 20. 20. 20. Minor Major/Significant Hydrocarbon releases are regarded as potential precursors to major accidents if ignited, and HSE.
7 Monitors the number of major and significant hydrocarbon releases as a key performance indicator (KPI) of the Offshore industry's effectiveness of process health and Safety management on Offshore installations. Based on provisional figures for 2011 /12: There was a significant reduction in the total number of Major and Significant HCRs (52) in 2011 /12 compared to the previous year's total of 73 and the annual average of 73 over the previous five years. The number of minor HCRs also showed a considerable reduction in 2011 /12 (75). compared to 2010/11 (93). Overall the total number of releases fell by 39 in 2011 /12. The UK Offshore industry has proposed a target 50% reduction in the total of all HCRs over the 2009/10 figure (187) by the end of March 2013 (details of the UK Offshore industry's HCR reduction plan can be found on the Oil & Gas UK website at ).
8 This implies a challenging target by 31st March 2013 of 94 HCRs of all severities ( total of Major, Significant and Minor HCRs). 2011 /12 (127) showed a 23% reduction in HCRs compared to 2010/11 (166) and a similar fall in 2012/13 will go close to achieving the target set. (Note that no specific target relating solely to Major and Significant HCRs has been set HSE will continue to monitor progress in this area. If achieved, a corresponding 50% reduction in Major and Significant HCRs would equate to 43 by end of March 2013.). RIDDOR reportable HCRs are unintended releases of petroleum gas or liquids from an Offshore installation which either result in fire or explosion or require action to prevent or limit the consequences of a potential fire or explosion if ignited, or which have the potential to cause death 5.
9 Major, Significant and Minor Release Severity Classifications are described on the HSE Website in the Hydrocarbons Release Database HELP facility ( ). or major injury. During 2011 /12 two releases ( of all reported HCRs) were reported as ignited events. Few of these HCRs gave rise to incidents which could, in whole or in part, be considered as oil spills 6 . The number of the liquid based HCR incidents where a quantity of hydrocarbon liquid was released to the sea in 2011 /12 was very small - seven in total with the amounts ranging from minimal to 19000kg. Supplementary data on hydrocarbon releases reported under RIDDOR are voluntarily reported to HSE by operators on Form OIR/12. Figure 6 is based upon those HCRs for which Form OIR/12. have been processed. Final figures may be subject to variation depending on when OIR/12.
10 Returns are made to HSE). Well incidents 2007 - 2011 . Well incidents were fewer in 2011 than for many years, both in absolute numbers and in relation level of rig activity. It should be noted, though, that the reduction is due in part to the low level of exploration drilling, especially in the Southern North Sea, where historically kicks from the Zechstein formations have been frequent. The number of reported incidents involving failure of a Safety critical element of a well is also slightly lower than in previous years. Table 1. All Offshore well incidents RIDDOR Description 2007 2008 2009 2010 2011 . Schedule *Uncontrolled flow from well 0 1 0 1 2. Close BOP to control flow 20 35 21 23 14. Detection of unexpected H2S 1 0 3 2 2. Well intersection / near miss 0 1 0 0 0. Failure of SCE of well 15 9 10 16 9.