Transcription of Offshore Wind in Europe
1 Subtittle if needed. If not MONTH 2018 Published in Month 2018 Offshore Wind in EuropeKey trends and statistics 2019 Offshore Windin trends and statistics 2019 Published in February 2020 TEXT AND ANALYSIS:Lizet Ram rez, WindEuropeDaniel Fraile, WindEurope Guy Brindley, WindEurope EDITOR:Colin Walsh, WindEuropeDESIGN:Lin Van de Velde, DrukvormFINANCE DATA:Clean Energy Pipeline and IJ GlobalAll currency conversions made at EUR/ GBP and EUR/USD include estimates for undisclosed valuesPHOTO COVER:Courtesy of Deutsche Bucht and MHI VestasMORE 2 213 11 68 This report summarises construction and financing activity in European Offshore wind farms from 1 January to 31 December regularly surveys the industry to determine the level of installations of foundations and turbines, and the subsequent dispatch of first power to the grid.
2 The data includes demonstration sites and factors in decommissioning where it has occurred. Annual installations are expressed in gross figures while cumulative capacity represents net installations per site and country. Rounding of figures is at the discretion of the publication contains information collected on a regular basis throughout the year and then verified with relevant members of the industry ahead of publication. Neither WindEurope nor its members, nor their related entities are, by means of this publication, rendering professional advice or services. Neither WindEurope nor its members shall be responsible for any loss whatsoever sustained by any person who relies on this EXECUTIVE SUMMARY .. 71. Offshore WIND INSTALLATIONS .. OVERVIEW .. NATIONAL BREAKDOWN OF 2019 INSTALLATIONS .. CUMULATIVE INSTALLATIONS.
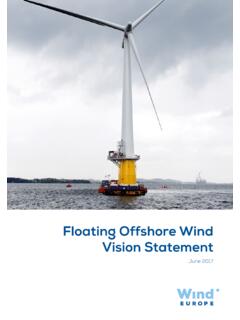
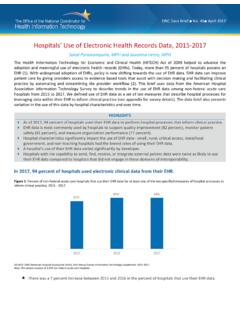
3 152. TRENDS: TURBINE SIZE, WIND FARM WIND TURBINE RATED CAPACITY .. WIND FARM SIZE .. WATER DEPTH AND DISTANCE TO SHORE .. FLOATING WIND .. 213. INDUSTRY ACTIVITY AND SUPPLY CHAIN .. WIND TURBINE MANUFACTURERS .. WIND FARM OWNERS .. SUBSTRUCTURES AND FOUNDATIONS .. CABLES .. VESSELS .. 294. INVESTMENTS & POLICY DEVELOPMENT .. FINANCING ACTIVITY .. Offshore WIND DEBT ACQUISITION ACTIVITY .. Offshore PPAs .. AUCTION RESULTS .. POLICY DEVELOPMENT .. 38 WINDFLOAT ATLANTIC PortugalStatus: Partially onlineCapacity: 25 MWNo. of turbines: 3 Owners: EDPR ( ), ENGIE (25%), Repsol ( ) & Principle Power ( )Turbine model: MW (MHI Vestas)Inter-array cable: JDR Cable systems Export cable: HengtongFoundation type: Semi-subFoundation supplier: ASM Industries (66%) & Navantia-Windrar Consortium (34%) Courtesy of Principle Power.
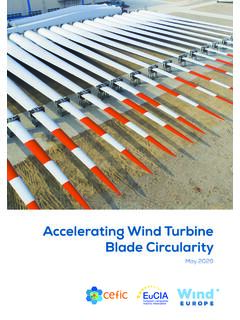
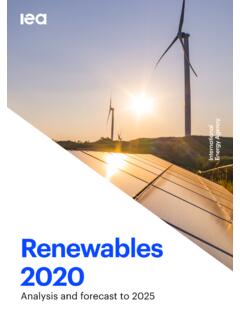
4 Artist: Dock907 Offshore Wind in Europe - Key trends and statistics 2019 WindEuropeEXECUTIVE SUMMARYFIGURE A Annual Offshore wind installations by country (left axis) and cumulative capacity (right axis) (GW)Source: WindEuropeEurope added 3,623 MW net Offshore capacity in 2019. This corresponds to 502 new Offshore wind turbines connected to the grid, across 10 wind now has a total installed Offshore wind capacity of 22,072 MW. This corresponds to 5,047 grid-connected wind turbines across 12 countries. Four new Offshore wind projects reached Final Decision Investment (FID) in four different countries during 2019, with construction starting in the coming years. Invest-ments in new assets accounted to in order to finance GW of additional installed capacity (GW)Annual installed capacity (GW)8 Offshore Wind in Europe - Key trends and statistics 2019 WindEuropeExecutive summaryInstallations in 2019 Europe added 3,627 MW of new (gross) capacity.
5 The UK (1,764 MW), Germany (1,111 MW), Denmark (374 MW), Belgium (370 MW) and Portugal (8 MW) supplied this new capacity to the grid. A net addition of 502 grid-connected Offshore wind turbines across 10 wind farms were added from 1 January to 31 December 2019. 7 wind farms were completed (fully grid-connected). Another 3 have partial grid connection and will continue to connect turbines in 2020. Construction work started on 5 other wind farms where no turbines have yet been grid-connected. Siemens Gamesa Renewable Energy account for 62% of the turbines connected to the grid. MHI Vestas Offshore Wind connected 28% and supplied turbines to five countries. 2 turbines (2 MW each) were decommissioned at the Blyth Demonstrator in the installations The installation and grid-connection of 5,047 turbines represents a cumulative 22,072 MW.
6 There are now 110 Offshore wind farms in 12 European countries (including sites with partial grid-connected turbines). The UK has the largest amount of Offshore wind capacity in Europe , with 45% of all installations. Germany is second with 34%, followed by Denmark (8%), Belgium (7%) and the Netherlands (5%). rsted (16%), RWE (12%), Vattenfall (7%) and Macquarie (7%) are the largest owners of Offshore wind : turbine and wind farm size, depth, distance from shore, auctions The average rated capacity of turbines installed in 2019 was MW, 1 MW larger than in 2018. The average size of wind farms in construction almost doubled in one decade (621 MW). The average distance to shore (59 km) and water depth (33 m) continue to increase even though most wind farms are bottom-fixed. All auction results in 2019 ranged between 40-50 /MWh.
7 Port of Rotterdam made history by installing the first GE Haliade-X 12 MW prototype. The first dynamic cable of 66 kV was installed by JDR for the Windfloat Atlantic. Hornsea One built the industry s first Offshore reactive compensation highlights In total GW of new capacity reached Financial Investment Decision during 2019 in France, the Netherlands, Norway and the UK. The financing raised for the 4 wind farms was , 40% less than in 2018. Refinancing was also lower than in 2019, at , bringing total financing for the sector to Non-recourse debt continues to be significant in Offshore wind financing with lent in 2019. This represents the second highest annual amount after the record offered in 2018. 2019 saw of project acquisition activity, with GW of projects in various stages of development acquiring new owners.
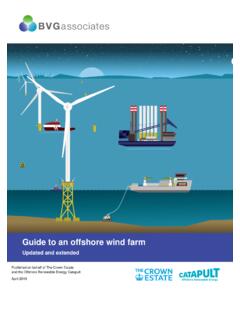
8 83% of acquisition investment was carried out by the financial services sector and two thirds of the acquisitions (by investment amount) was for operational wind nameOffshore Wind in Europe - Key trends and statistics 2019 WindEuropeBORSSELE 3&4 The NetherlandsStatus: Under constructionCapacity: MWNo. of turbines: 77 Owners: Partners Group (45%), Shell (20%), Diamond Generating Europe Limited (15%), Van Oord (10%) & Eneco (10%) Turbine model: MW (MHI Vestas)Inter-array cable: PrysmianExport cable: NKT GroupType of foundation: MonopilesFoundation supplier: Sif Courtesy of Van Oord10 Offshore Wind in Europe - Key trends and statistics OVERVIEW Europe connected 3,623 MW of net Offshore wind power capacity in 2019, setting a record in annual Offshore instal-lations. It added 3,627 MW of new (gross) capacity. The UK (1,764 MW), Germany (1,111 MW), Denmark (374 MW), Belgium (370 MW) and Portugal (8 MW) supplied this new capacity to the grid.
9 The UK, Denmark and Belgium set national installation records in 2019. The Netherlands did not connect any Offshore turbine to the grid but started the installation of monopiles at the Borssele 3&4 sites, which are expected to come online in 2020. Spain tested the first multi-tur-bine floating platform at the PLOCAN demonstration facil-ities in the Canary Islands. 2 turbines (2 MW each) were decommissioned at the Blyth Demonstrator in the s cumulative Offshore wind capacity reached 22,072 MW at the end of 2019. Including sites with partial grid connection, there are now 110 Offshore wind farms in 12 European countries and 5,047 grid-connected wind WIND INSTALLATIONS11 Offshore Wind in Europe - Key trends and statistics 2019 WindEuropeOffshore wind installations1. It includes 14 demonstrators (single turbine or announced as demonstrator by developer).
10 FIGURE 1 Annual Offshore wind installations by country (left axis) and cumulative capacity (right axis) Source: installed capacity (GW)Annual installed capacity (GW)TABLE 1 Overview of grid-connected Offshore wind power projects at the end of 2019 COUNTRYNO. OF WIND FARMS CONNECTED1 CUMULATIVE CAPACITY (MW)NO. OF TURBINES CONNECTEDNET CAPACITY CONNECTED IN 2019 (MW)NO. OF TURBINES CONNECTED IN 2019UK409,9452,2251,760252 Germany287,4451,4691,111160 Denmark141,70355937445 Belgium81,55631837044 Netherlands61, ,0725,0473,623502-GWGWG ross installations in 2019 Cumulativeinstalled capacityat the end of GWTOTAL EUROPEOF NEW OFFSHOREWIND POWER IN GW2 Source: WindEurope12 Offshore Wind in Europe - Key trends and statistics 2019 WindEurope13 Offshore Wind in Europe - Key trends and statistics 2019 WindEuropeOffshore wind installations2. Only showing those countries with more than GW.