Transcription of OKLAHOMA COVID-19 WEEKLY REPORT
1 OKLAHOMA COVID-19 WEEKLY REPORT . WEEKLY Epidemiology and Surveillance REPORT March 13 - 19, 2022.. PURPOSE To provide up-to-date WEEKLY epidemiological data on COVID-19 in OKLAHOMA .. WEEKLY SUMMARY. FOR MARCH 13-19, 2022. Cases1. Previously Reported Cases 1,029,635. New Cases week of March 13 March 19 459. Total Cumulative Cases 1,031,448. Deaths2. Previously Reported Deaths 13,730. Newly Reported Deaths 159. Total Deaths 13,889. 1. WEEKLY case total is based on the number of cases with a symptom onset/specimen collection date in the given time frame. The cumulative total includes new cases as well as older cases identified as a result of delayed reported. 2. Newly reported deaths had dates of death ranging from Oct.
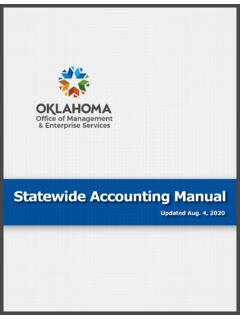
2 2021 to Mar. 2022 with the majority occurring in Feb. 2022. Please refer to the graph on page 9 which shows when newly reported deaths occurred. COVID-19 WEEKLY Epidemiology REPORT / March 13-19, 2022 / Updated March 23, 2022 Page 1 of 26. COVID- 19 VACCINE DATA BY TOTAL AND KEY METRICS1 March 16-22 Total Number Doses Administered 12,183 4,694,927. At least 1 dose2 3,413 2,203,293 Fully vaccinated3 3,560 1,863,225 Male Female Unknown 1. Doses administered amount does not include doses administered by federal entities in OKLAHOMA . 2. At least one does refers to individuals (ages 5 years+) receiving Pfizer and Moderna COVID-19 vaccines At least 1 dose Fully vaccinated and/or receiving single shot of J&J/Janssen Vaccine.
3 3. Fully vaccinated refers to individuals (ages 5 years+) fully vaccinated after receiving either Pfizer and/or Moderna COVID-19 vaccines (both doses) and/or receiving single shot of J&J/Janssen Vaccine. Hispanic/ Latino Not Hispanic/ Latino Unknown At least 1 dose Fully vaccinated White Black Asian/Pacific Islander American Indian Other 5-11 12-17 18-24 25-34 35-44 45-54 55-64 65-74 75-84 85+ Unknown At least 1 dose Fully vaccinated At least 1 dose Fully vaccinated Source: COVID-19 Vaccination Reporting Specification Dataset OKLAHOMA State immunization information system (OSIIS). Data reflect information entered as of 11:59PM 3/22/2022. Data does not include doses administered by federal entities in OKLAHOMA COVID-19 WEEKLY Epidemiology REPORT / March 13-19, 2022 / Updated March 23, 2022 Page 2 of 26.
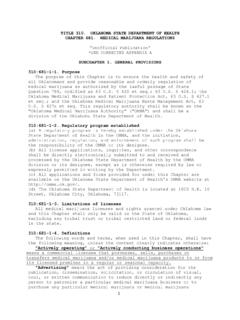
4 COVID-19 VACCINATIONS IN OKLAHOMA - FEDERAL AND STATE, AS OF MARCH 22, 2022. Adult Rate Count* per 100K. Total Doses 5,770,476 176,549. Administered Additional doses 820,579 na (booster/3rd). Administered *Includes state and federal administered doses. Percent of 5+ Population with At Least 1 Dose- OKLAHOMA Counties At Least 1 At Least 1 At Least 1 At Least 1 At Least 1. County County County County County Dose (%) Dose (%) Dose (%) Dose (%) Dose (%). Adair Cotton Jackson McIntosh Roger Mills Alfalfa Craig Jefferson Murray Rogers Atoka Creek Johnston Muskogee Seminole Beaver Custer Kay Noble Sequoyah Beckham Delaware Kingfisher Nowata Stephens Blaine Dewey Kiowa Okfuskee Texas Bryan Ellis Latimer OKLAHOMA Tillman Caddo Garfield LeFlore Okmulgee Tulsa Canadian Garvin Lincoln Osage Wagoner Carter Grady Logan Ottawa Washington Cherokee Grant Love Pawnee Washita Choctaw Greer Major Payne Woods Cimarron Harmon Marshall Pittsburg Woodward Cleveland Harper Mayes Pontotoc Coal Haskell McClain Pottawatomie Comanche Hughes McCurtain Pushmataha Source.
5 CDC COVID Data Tracker COVID-19 Vaccinations in the United states and COVID-19 Integrated County View. Posted: 3/22/2022. COVID-19 WEEKLY Epidemiology REPORT / March 13-19, 2022 / Updated March 23, 2022 Page 3 of 26. STATE ADMINISTERED COVID- 19 VACCINATION DEMOGRAPHICS*. Total Population People who received People who are fully 5 years of age at least 1 dose vaccinated OKLAHOMA 3,727,267 2,203,293 ( ) 1,863,225 ( ). Gender Male 1,841,326 ( ) 1,025,728 ( ) 859,866 ( ). Female 1,885,941 ( ) 1,174,527 ( ) 1,001,429 ( ). Unknown 3,038 1,930. Age group 5-11 376,571 ( ) 62,027 ( ) 49,052 ( ). 12-17 323,433 ( ) 133,463 ( ) 113,570 ( ). 18-24 381,974 ( ) 194,007 ( ) 157,763 ( ).
6 25-34 545,036 ( ) 285,162 ( ) 234,989 ( ). 35-44 505,948 ( ) 308,149 ( ) 260,010 ( ). 45-54 451,176 ( ) 303,051 ( ) 257,805 ( ). 55-64 489,970 ( ) 365,518 ( ) 313,081 ( ). 65-74 380,547 ( ) 325,932 ( ) 281,823 ( ). 75-84 197,625 ( ) 166,154 ( ) 143,963 ( ). 85+ 74,987 ( ) 59,675 ( ) 51,145 ( ). Race White 2,889,695 ( ) 1,351,814 ( ) 1,215,136 ( ). Black 330,151 ( ) 125,894 ( ) 109,550 ( ). Asian/PI 107,435 ( ) 75,728 ( ) 65,872 ( ). American Indian 399,986 ( ) 139,439 ( ) 112,162 ( ). Other - 97,859 78,796. Unknown - 412,559 281,709. Ethnicity Hispanic or Latino 403,212 ( ) 209,110 ( ) 178,941 ( ). Not Hispanic or Latino 3,324,055 ( ) 1,385,760 ( ) 1,268,474 ( ).
7 Unknown - 2,203,293 ( ) 1,863,225 ( ). Note: Fully vaccinated refers to individuals (ages 5 years+) completing series after receiving either Pfizer and/or Moderna COVID-19 vaccines (both doses) and/or receiving single shot of J&J/Janssen Vaccine. Data Source: 1. Vintage 2020 bridged-race postcensal population estimates files contain estimates of the resident population of the United states as of April 1, 2010 - July 1, 2020 (based on the 2010 census). Released by the National Center for Health Statistics (NCHS) 2. Vaccination Reporting Specification (CVRS) Dataset - OKLAHOMA State immunization information system (OSIIS); Data reflect information entered as of 11:59PM 03/22/2022.
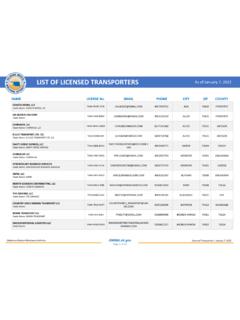
8 *Data does not include doses administered by federal entities in OKLAHOMA . COVID-19 WEEKLY Epidemiology REPORT / March 13-19, 2022 / Updated March 23, 2022 Page 4 of 26. OKLAHOMA COVID-19 AT LEAST 1 DOSE COUNTY LEVEL VACCINE ADMINISTRATION FOR AGES 5+ AND 65+. COVID-19 WEEKLY Epidemiology REPORT / March 13-19, 2022 / Updated March 23, 2022 Page 5 of 26. OKLAHOMA COVID-19 FULLY VACCINATED COUNTY LEVEL VACCINE ADMINISTRATION FOR AGES 5+ AND 65+. COVID-19 WEEKLY Epidemiology REPORT / March 13-19, 2022 / Updated March 23, 2022 Page 6 of 26. COVID-19 VARIANT STRAINS SEQUENCED*. Note: Data presented represent samples sequenced by the OKLAHOMA Public Health Lab (PHL) or other Reference Labs that reported the results to the OSDH.
9 The PHL sequences all samples which are received and that meet necessary sample collection and specimen quality *No results for sequenced specimens collected between 2/16-2/25 were available at the time of this REPORT for regions 1, 3, 7, 8, and 9. requirements. As additional samples are sequenced, these percentages may change. COVID-19 WEEKLY Epidemiology REPORT / March 13-19, 2022 / Updated March 23, 2022 Page 7 of 26. DISTRIBUTION OF RECENT COVID-19 HOSPITAL ADMISSIONS BY VACCINATION STATUS AND. AGE GROUP AS OF MARCH 22, 2022+. Hospital Admissions Percentage within Percentage of Vaccination Status Age Group in the last 30 days** Vaccination Status Category Total Hospitalizations Non-Vaccinated Under 1- 4 1 5-17 0 18-35 8 36-49 14 50-64 34 65+ 75 Unknown 3 Total 135 Fully Vaccinated* 5-17 1 18-35 6 36-49 0 50-64 15 65+ 25 Unknown 0 Total 47 Partially Vaccinated** 5-17 0 18-35 0 36-49 1 50-64 2 65+ 15 Unknown 0 Total 18 Total Hospitalizations 200.
10 +. Data are preliminary and subject to change as more information is gathered, reviewed and quality assurance procedures are applied. The information presented in the table above (hospital admissions by vaccination status) will be limited to cases reported two (2) weeks prior allowing for additional review and quality assurance checks to be applied. *Fully Vaccinated Vaccine breakthrough cases are defined as an individual with a COVID-19 positive laboratory results (PCR/Antigen) and documentation of COVID-19 vaccination that meets the definition of fully vaccinated. (Individuals are considered fully vaccinated 2 weeks after receiving the last dose in the COVID-19 vaccine series.)