Transcription of OneTechnologyWay P.O.Box9106 Norwood,MA 02062 …
1 AN-1368 APPLICATION NOTE One Technology Way P. O . Box 9106 Norwood, MA 02062 -9106, Tel: Fax: Ferrite Bead Demystified By Jefferson Eco and Aldrick Limjoco INTRODUCTION High resolution, high performance converters and radio frequency (RF) systems require a low noise design of the power supply to achieve optimum performance. Good filtering of power supply noise and high frequency crosstalk reduction between analog and digital domains is required, especially on mixed-signal converters and transceivers. Power supply noise is more evident with switching regulators, which generate undesired output artifacts that can be harmful to any noise sensitive system.
2 However, due to their high power conversion efficiency, switching regulators are often found in portable devices where prolonged battery life is needed and in systems where thermal limitations exist. Similar digital and analog voltage rails of mixed-signal ICs are often powered from different power domains. This approach helps to prevent fast digital switching noise coupling onto the sensitive analog supply rail and degrading the converter performance, but it increases system level complexity and cost. With proper high frequency isolation of supply domains, power supplies can be shared between analog and digital domains, simplifying the design and reducing the cost.
3 An effective method for filtering high frequency power supply noise and cleanly sharing similar supply rails is the use of ferrite beads . A ferrite bead is a passive device that filters high frequency noise energy over a broad frequency range. It becomes resistive over its intended frequency range and dissipates the noise energy in the form of heat. The ferrite bead is connected in series with the power supply rail and is often combined with capacitors to ground on either side of the bead. This forms a low-pass filter network, further reducing the high frequency power supply noise. Figure 1 shows an example of a filtering scheme often used in mixed-signal ICs to separate analog and digital supplies.
4 The scheme is suitable for any power distribution network; however, understanding its effectiveness and limitations helps users to avoid characteristics that may, for example, be detrimental in high performance converter applications. This application note discusses the important considerations that system designers need to be aware of when using ferrite beads in power supply systems, including response characteristics of the ferrite bead, a simplified ferrite bead model and simulation, dc current considerations, LC resonance effects, and damping methods. An understanding of these elements can make the system design approach fast and effective. The Analog Devices, Inc.
5 , products used to demonstrate the effects of ferrite beads as output filters are the A, MHz synchronous step-down switching regulator (ADP2120) and the 2 A dc-to -dc switching regulator with independent positive and negative outputs (ADP5071). Figure 1. Sample Filter Scheme for a Mixed-Signal IC POWERSUPPLYANALOGSUPPLYDIGITALSUPPLYFERR ITEBEAD13359-001 Rev. 0 | Page 1 of 11 AN-1368 Application Note TABLE OF CONTENTS Introduction .. 1 Revision History .. 2 Ferrite Bead Response Characteristics .. 3 Ferrite Bead Simplified Model and Simulation .. 3 DC Bias Current Considerations .. 4 LC Resonance Effect ..6 Damping Methods ..9 11 References .. 11 REVISION HISTORY 8/15 Revision 0: Initial Version Rev.
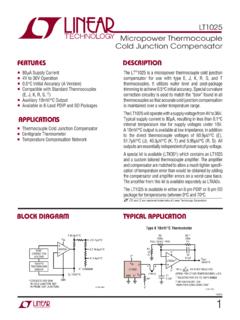
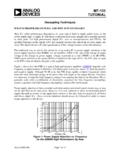
6 0 | Page 2 of 11 Application Note AN-1368 FERRITE BEAD RESPONSE CHARACTERISTICS Ferrite beads are categorized by three response regions: inductive, resistive, and capacitive. These regions can be determined by looking at a ZRX plot, where Z is the impedance, R is the resistance, and X is the reactance of the bead. To reduce high frequency noise, the bead must be in the resistive region; this is especially desirable for electromagnetic interference (EMI) filtering applications. The component acts like a resistor, which impedes the high frequency noise and dissipates it as heat. The resistive region occurs after the bead crossover frequency (X = R) and up to the point (shown in Figure 2) where the bead becomes capacitive.
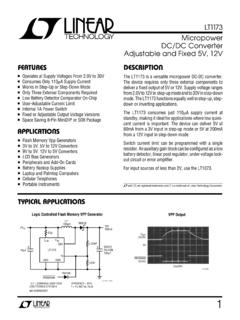
7 This capacitive point occurs at the frequency where the absolute value of capacitive reactance is equivalent to R. Figure 2. Tyco Electronics BMB2A1000LN2 ZRX Plot At relatively low frequencies below crossover, the bead response is inductive. At high frequencies, the bead response is capacitive. In this case, the falling slope of the impedance vs. frequency plot is defined by the parasitic capacitance associated with the component. FERRITE BEAD SIMPLIFIED MODEL AND SIMULATION A ferrite bead can be modeled as a simplified circuit consisting of resistors, an inductor, and a capacitor, as shown in Figure 3. RDC corresponds to the dc resistance of the bead. CPA R, LBEAD, and RAC are the parasitic capacitance, the bead inductance, and the ac resistance (ac core losses) associated with the bead.
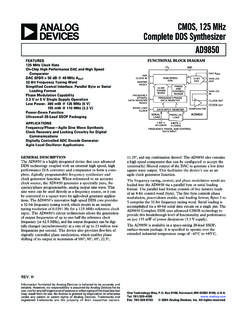
8 Figure 3. Simplified Circuit Model In some cases, the simplified circuit model shown in Figure 3 can be used to approximate the ferrite bead impedance characteristic up to the sub-GHz range. The Ty c o Electronics BMB2A1000LN2 multilayer ferrite bead is used as an example. Figure 4 shows the measured ZRX response of the BMB2A1000LN2 for a zero dc bias current using an impedance analyzer. The circuit simulator suite used was the ADIsimPE, a simulation tool optimized for the design and development of analog and mixed-signal circuits. ADIsimPE is powered by SIMetrix/SIMPLIS. Figure 4. BMB2A1000LN2 ZRX Plot For the region on the measured ZRX plot where the bead appears most inductive (Z XL; LBEAD), the bead inductance is calculated by the following equation: fXLLBEAD = 2 (1) where: f is the frequency point anywhere in the region the bead appears inductive.
9 In this example, f = MHz. XL is the reactance at MHz, which is 233 . Equation 1 yields an inductance value (LBEAD) of H. For the region where the bead appears most capacitive (Z |XC|; CPA R), the parasitic capacitance is calculated by the following equation: ||21 CPARXfC = (2) where: f is the frequency point anywhere in the region the bead appears capacitive. In this example, f = 803 MHz. |XC| is the reactance at 803 MHz, which is . Equation 2 yields a parasitic capacitance value (CPA R) of pF. 0200400600800100012001101001000 IMPEDANCE ( )FREQUENCY (MHz)RXCROSSOVERFREQUENCYZINDUCTIVE13359 -002 CAPACITIVERESI STIVERDCCPARRACLBEAD13359-00302004006008 00100012001101001000 IMPEDANCE ( )FREQUENCY (MHz)RXZ13359-004Z =R; RACZ XL; LBEADZ |XC|;CPARRev.
10 0 | Page 3 of 11 AN-1368 Application Note The dc resistance (RDC), which is 300 m , is acquired from the manufacturer data sheet. The ac resistance (RAC) is the peak impedance where the bead appears to be purely resistive. Calculate RAC by subtracting RDC from Z. Because RDC is very small compared to the peak impedance, it can be neglected. Therefore, in this case RAC is k . The ADIsimPE circuit simulator tool was used to generate the impedance vs. the frequency response. Figure 5 shows both the actual measurement and simulated measurement for the impedance vs. the frequency response at zero dc bias current and Figure 6 shows the circuit simulation model with the calculated values.