Transcription of Opioids in Alameda County - ACPHD
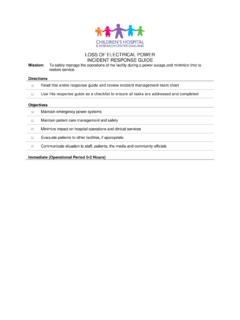
1 0246810122006 2007 2008 2009 2010 2011 2012 2013 2014 Mortality Rate per 100,000 United StatesCaliforniaAlameda County75,533,899 159,124,393 20012015 Opioid Prescriptions (Grams)Prescription Opioids sold in the more than doubled from 75 million grams in 2001 to 159 million grams in 2015, yet there has not been a decrease in the amount of pain that Americans report. The amount (in grams) of oxy-codone and hydrocodone alone tripled from 2000 to health care pro-viders wrote 259 million prescriptions for opioid painkillers in 2012 enough for every American adult to have his or her own bottle of the Across the nation, as more Opioids become available, the rates of opioid use disorders and opioid deaths continue to increase. Opioid Prescriptions, United States Opioid Mortality Rates Nationally, there were 28,647 opioid-related deaths in 2014. Age-adjusted rates of opioid deaths in Alameda County are lower than state and national rates, with the California rate twice as high, and the rate typically three times the rate in Alameda County .
2 However, like the state and national trends, rates in Alameda County have been increasing in the most recent While Alameda County rates may not be as dramatic compared to the na-tional rates, opioid use in Alameda County exceeds that of other countries and continues to be of great concern. According to the United Nations Office on Drugs and Crime, the rate of drug deaths among individuals aged 15-64 in the United States ( per 100,000) is twelve times that of Germany ( per 100,000). By point of comparison, drug death rates in 2014 among this age group for California and Alameda County were and , Since 2008, drug overdose deaths in the have surpassed deaths from mo-tor vehicles and have been on a steady upward trend. From 2000 to 2014, nearly half a million people died from drug overdoses, with more drug over-doses in 2014 than in any year on record. More than six out of ten drug over-dose deaths involve an opioid. Since 1999, the number of overdose deaths in the involving Opioids , including prescription opioid pain relievers and heroin, nearly Injury Deaths, United States 010,00020,00030,00040,00050,00060,000200 4 2005 2006 2007 2008 2009 2010 2011 2012 2013 2014 Number of DeathsDrug Overdose DeathsMotor Vehicle DeathsOpioids in Alameda County This fact sheet is intended to inform local clinicians and policymakers about the extent of the opioid problem in Alameda County , with special emphasis on trends in prescribing practices and negative consequences of opioid use, both prescription and non-prescription.
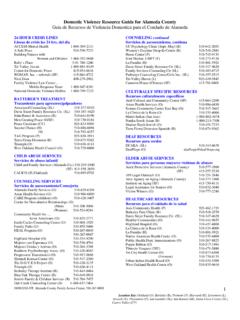
3 Where possible, we highlight the populations most affected by opioid use disorders and poisoning. The increased number of prescriptions written and dispensed contributes greatly to the current opioid epidemic. In Alameda County , opioid prescrip-tions were written at a rate of prescriptions per 1000 residents in 2015, roughly equal to one prescription for every two residents of the Opioid Prescriptions, Alameda County One prescription for One prescription for every two residentsevery two residents 2012 2013 2014 2015 Opioid prescriptions per 1000 residents (excl.)
4 Buprenorphine) Hydrocodone (Norco 5mg equivalent) per resident Residents on >40 mg methadone daily (for 30 days) per 1000 residents Residents on combination Opioids /benzos (for 30 days) per 1000 residents Buprenorphine prescriptions per 1000 residents The Alameda County workgroup identified key opioid prescribing metrics that help us understand trends in Alameda County . Overall, prescribing patterns for Opioids , amounts of 5mg Norco equivalents, residents on high dose methadone, and patients on combination opioid/benzodiazepines (a high mortality risk population) are declining. Buprenorphine, also known as Suboxone, is often used in medication-assisted treatment in opioid use dis-orders. Buprenorphine prescriptions are increasing over time, but decreased slightly in Key Opioid Prescription Measures, Alameda County Each day, 78 Ameri-Each day, 78 Ameri-cans die from an cans die from an opioid overdoseopioid overdose Total grams more Total grams more than doubledthan doubled Drug Treatment Episodes, Alameda County Behavioral health care Services Over the past seven years, drug treatment episodes for heroin at BHCS-contracted providers have exceeded those for other Opioids .
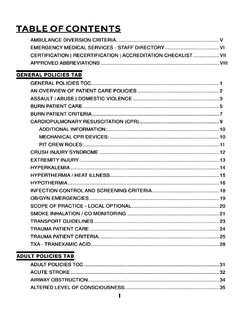
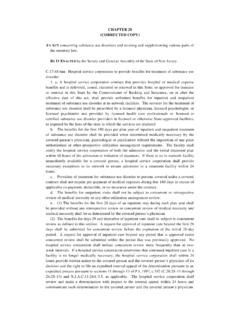
5 Between 2010 and 2012, the number of heroin-related treatment episodes was three times that of other Opioids , increasing to seven times in 2015. Drug treatment epi-sodes for heroin use increased from 2011 to 2014 and dropped in 2015, while the number of drug treatment visits for opioid use has remained steady. These numbers do not include those treatments paid for by private insurance or self 05001,0001,5002,0002,5003,00020092010201 12012201320142015 Number of EpisodesHeroinOpioidsOpioid-Related Emergency Department Visits, Alameda County One important measure of adverse consequences resulting from the use of Opioids , whether prescription or not, is the number and rate of visits to the hospital emergency department (ED). As currently defined, an opioid-related ED visit is one in which a patient has a diagnosis code, either primary or associated, of opioid use disorders or poisoning. The rate of opioid-related ED visits in Alameda County increased 29% between 2009 and 2014.
6 The rate among African Americans, was three times that of the County rate. Ad-ditionally, the rate increase for African Americans from 2009 to 2014 was greater than the increase in the County , at 37%. Over the same period, the rate among Whites increased 22% while among Hispanic/Latinos it in-creased 63%. Although the Asian rate has remained low, it increased 50% over the time period. Native Americans and Pacific Islanders are not pre-sented here due to small numbers but recent increases in incidents are cause 0501001502002503003504002009 2010 2011 2012 2013 2014 Age Adjusted Rate per 100,000 AfAm/BlackWhiteAll RacesHisp/LatAsianSources and Notes 1. Automated Reports and Consolidated Ordering System (ARCOS), Department of Justice, Drug Enforcement Administration, Diversion Control Division ( ); 2. CDC Vital Signs, July 2014 ( ). 3. California Department of Justice, Controlled Substance Utilization Review and Evaluation System (CURES ), data prepared by Brandeis University PDMP Center of Excellence, from California Depart-ment of Public health .
7 4. California Department of Justice, Controlled Substance Utilization Review and Evaluation System (CURES ), data prepared by Brandeis University PDMP Center of Excellence, from California Depart-ment of Public health . 5. Centers for Disease Control and Prevention, National Center for health Statistics, Vol 65, ; ( ). for Disease Control and Prevention, National Center for health Statistics, Multiple Cause of Death 1999-2014 on CDC WONDER Online Database, released 2015 ( ( ). 7. United Nations Office on Drugs and Crime ( ); Centers for Disease Control and Prevention, National Center for health Statistics, Multiple Cause of Death 1999-2014 on CDC WONDER Online Database, released 2015. 8. Alameda County Public health Department CAPE Unit, with data from the Office of Statewide health and Development (OSHPD), 2012-2014. 9. Alameda County Public health Department CAPE Unit, with data from the Office of Statewide health and Development (OSHPD), 2012-2014.)
8 10. Alameda County Public health Department CAPE Unit, with data from the Office of Statewide health and Development (OSHPD), 2014; 11. Costs for 2009 and 2014 are estimated costs paid by payers based on a cost-to-charge percentage of total charges as defined by the Office of Statewide health and Development (OSHPD) ( ). 12. Alameda County Public health Department CAPE Unit, with data from Alameda County Behavioral health care Services, 2005-2015. Opioid-Related Emergency Department Visits, Cities in Alameda County Opioid-related emergency department visits vary widely across Alameda County locations, from a low of per 100,000 in Fremont to a high of per 100,000 in Oakland, a four-fold difference. Relatively high rates were also seen in Hayward and San Leandro, suggesting concentration of the burden of illness in central portions of the CityNewarkPleasantonAlamedaCastro ValleySunolBerkeleySan LorenzoLivermoreAlameda CountySan LeandroHaywardOaklandAge Adjusted Rate per 100,000 Produced by the Community Assessment Planning and Evaluation (CAPE)
9 Unit Alameda County Public health Department health care Services Agency 1000 Broadway, Suite 500, Oakland, CA 94607 Kathleen Clanon, , FACP Medical Director, health care Services Agency Copyright 2016, Alameda County health care Services Agency Estimated Cost of Opioid-Related Hospitalizations, Alameda County In 2014, the estimated costs of opioid-related hospitalizations in Alameda County exceeded $ million, a 45% increase from In 2014, two-thirds of 859 opioid-related hospitalizations were for individuals with a source of payment from public funds (such as Medicare, Medi-Cal, or the Alameda County indigent care program, HealthPAC).11 $ million$ million$0$2,000,000$4,000,000$6,000,000$ 8,000,000$10,000,000$12,000,00020092014 Total Hospitalization Costs45% increase 45% increase 2009 to 20142009 to 2014