Transcription of Optical Wavefront Interferometry evolution, …
1 Optical Wavefront Interferometry evolution , challenges and opportunities Dominic F. Murphy1, Noel Healy2 and Pier Sazio2 1 Pie Photonics Ltd., Tullamore, Co. Offaly, Ireland 2 Optoelectronics Research Centre, University of Southampton, UK Abstract: Optical Wavefront Interferometry has evolved into increasingly compact and portable forms with optimizations and novel developments from multi-component, bulk-optic configurations to miniaturized multi-core fiber forms; each presents its own advantages, challenges and opportunities . OCIS codes: Coherence; Fourier optics and signal processing; Instrumentation, measurement and metrology; Nonlinear optics; Spectroscopy 1.
2 evolution Grimaldi s investigations into diffraction phenomenon in the 17th century [1] led him to investigate a 2-slit interferometer configuration that ultimately failed to produce the desired interference fringes because his source, the Sun s disk, lacked the required spatial coherence. In his efforts to establish the wave nature of light, Thomas Young repeated Grimaldi s experiments with the addition of an initial pinhole to create a spatially coherent beam to illuminate the 2-slit Wavefront interferometer configuration that produced a series of alternating bright and dark interference fringes [2], the results of which were presented to the Royal Society of London in 1803. Throughout the 19th century, several important developments followed resulting in myriad configurations and culminating in the famous Michelson and Michelson Morley experiments of 1881 and 1887 respectively.
3 Interferometry is a cornerstone of powerful, sophisticated and sensitive measurements, as clearly evidenced by the range of applications it has found use in and discoveries it has critically enabled. Examples of common use since the latter half of the 20th century include, for example, Optical component testing [3], communications [4, 5] and sensing [6-9], all of which have benefitted from improved signal analysis and digital signal processing techniques including, , Fourier processing [10-12]. Over recent decades diffraction grating spectrometers have become portable, convenient and powerful measurement tools for a wide range of field and laboratory applications. In general, diffraction gratings interrupt an incident Wavefront to produce several distinct, diffracting point sources that overlap as they propagate outwards to form a superposed multi-interference field pattern.
4 While this proves a convenient and effective approach to recovering spectral amplitude in many applications, unfortunately, temporal and phase information is lost, multi-order diffractions impede bandwidth and throughput and resolution fall off away from a narrow wavelength region of optimized operation. Using the simpler 2-beam approach together with Fourier processing provides convenient access to time, phase, frequency and spectral information. In the early 1990s several research groups laid the foundations for mobilizing Optical Interferometry by using, for example, electronically scanned [13-17] and tunable source [18] techniques. Electronically and statically scanned [19, 20] approaches took advantage of detector array technology to enable the instant digital capture of 2-beam spatial interference patterns thereby providing access to all the interferometer information in a single, simple instrument.
5 Among the simplest and lowest form factor Optical interferometers are the waveguide [21] and single Optical fiber versions [22-24]. The parallel evolution integrated circuits in terms of miniaturization, increased processing power and speed alongside increasingly reducing Optical component size has opened the door for a new age of high-value, high-accuracy, high-resolution, cost-effective, information-rich, portable Interferometry . 2. Theory The complex degree of coherence function 12~ has both an argument that determines the quality of interference, and a modulus that determines the magnitude of interference. Consequent to the Optical equivalent of the Wiener-Khintchine theorem, 12~and the normalised complex interferogram spectrum, 12exp~iG are Fourier transform pairs which gives rise to the relationships [10-12, 20, 25] osIiGF 12exp~; osIGF ~ (1) where Ios( ) is the oscillatory component of the interferogram andF denotes a Fourier transform.
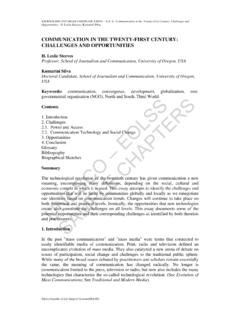
6 Phase, 12 is recovered from the argument of the Fourier transform of Ios( ) and cumulative delay imbalance 12( 0) at a given frequency 0 in the interferogram spectrum is found directly from the first order fit coefficient of the Taylor expansion due to the relationship between cumulative delay imbalance and phase, defined as dd012012 (3) 3. challenges and opportunities Fig. 1a. Selection of Optical Wavefront interferometer engine types to combine with detector arrays. Fig. 1b. Tandem interferometer with portable receiving interferometer, PIE for the measurement of nonlinear index of a 2mm thick zinc selenide (ZnSe) sample. S, source; FS, fiber splitter; GLCF, grin lens connectorized fiber; M, mirror; XYZ, xyz translation stage.
7 Figure 1a shows a selection of interferometer engine types that can be combined with a detector array or camera of choice that is used to capture the interference fringes, to optimize performance for a particular application. Except for the Fabry-P rot type that has limited free spectral range and produces a multi-point interference pattern similar to diffraction gratings, these engines offer the advantages of multi-octave operation without the need for filters. The Twyman-Green type suffers from reduced Optical throughput with 50% of the input light being reflected back to the source. The Fresnel bi-prism and Young double-slit configurations both transmit light through some material that is chosen to offer high transmission in the region of interest.
8 This material dependence eventually restricts the operating bandwidth and introduces wavelength dependent losses and dispersive effects. Lloyd s mirror offers the opportunity for high transmission over a very wide spectral bandwidth for the optimum choice of reflector material, with minimized wavelength dependent performance issues, such as loss and dispersion. Figure 2a shows example unwrapped spectral phase information recovered from 550nm and 810nm pulsed sources along with an 815nm centered superluminescent diode (SLD). Fig. dependent unwrapped source spectral phase from 550nm pulsed, 810nm pulsed and SLD CW sources. Fig. 2b. Coherence and Delay dependent interferograms from 810nm pulsed Ti:Sapphire source: 810nm - source only; 810nm LP - Watt level peak power through system shown in Fig.
9 1b including 2mm thick ZnSe sample; 810nm HP - kiloWatt level peak power through Fig. 1b system. XYZ GLCF M ZnSe GLCF M XYZ FS PIE S Twyman-Green Lloyd Fabry-P rot Young Fresnel (a) (b) 550nm 810nm SLD 810nm 810nm LP 810nm HP (a) (b) In Figure 1b, a novel application of a static Wavefront Optical interferometer, PIE, used in a tandem interferometer configuration for the investigation of nonlinear index dependence of the system, including a ZnSe sample, when pumped with different power pulses from a Ti:Sapphire source is shown. The differences in pulse energy induce a change in the sample nonlinear index that is manifest as a delay change through inspection of the delay dependent interferograms shown in Figure 2b that contains both central and measurement interferogram that clearly exhibit effects of dispersion.
10 Using this approach, a static, zero-scan , attosecond resolution measurement of delay is achieved for the system where the HP satellite measurement interferogram is delay shifted with respect to the LP interferogram as a result of higher peak power. Other results of interest include picometer wavelength accuracy levels in the interrogation of FBG sensor arrays around 800nm from Aston Institute of Photonic Technologies and in the measurement of laser wavelength and linewidth from the EKSPLA NT-300 (400nm to 710nm). 4. Acknowledgements The authors gratefully acknowledge support from: Lin Zhang and Zhijun Yan, Aston Institute of Photonic Technologies, Aston, UK; Tim Birks and Yong Chen, University of Bath, Bath, UK; Michael Myers, Kigre Inc.