Transcription of OR ACL E D AT A SH E ET Powerful Visual Analytics for the ...
1 O R A C L E D A T A S H E E T Powerful Visual Analytics for the Entire Organization oracle business intelligence 12c Analytics should be more than a mirror of the past. As a strategic practice, it offers the ability to understand what is happening in the moment, and help you predict where your business can go. Making Analytics a strategic practice requires a strategic platform that serves the entire organization s needs from the agility of Visual Analytics and self-service data discovery, to the power of an enterprise platform, including operational analysis at scale, security, reliability, extreme performance, and centralized management.
2 Only oracle combines this agility and power in a single platform because you shouldn t have to choose between ease-of-use and world-class Analytics . K E Y B E N E F I T S Stunningly Visual and easy to use. Faster time to value, higher ROI. Radically simple install, upgrade, and management for lower TCO. Comprehensive platform, from self-service to advanced Analytics to operational analysis at scale. Seamless Analytics across Cloud and on-premises. Self-service agility in a central, secure platform. No modeling or specialized resources required for data mashup.
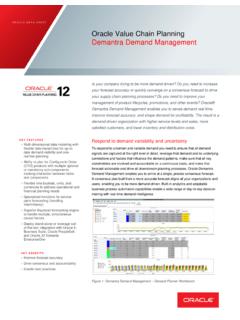
3 Instant mobile, no extra work required. Voice-enabled talk to your data. Analytics anywhere with full mobile authoring. Easy to extend advanced Analytics . Direct access to Big Data sources. Faster in-memory processing. Visual Analytics Visualizing data makes analysis faster and easier, and makes insights more readily available to everyone across the organization. Data Visualization in oracle business intelligence 12c (BI 12c) offers a rich consumer-style experience that is now common across oracle s Analytics portfolio. Additionally, the entire user experience has been streamlined, demonstrating oracle s continued commitment to making Analytics as fast, flexible, and friendly as they are Powerful and robust.
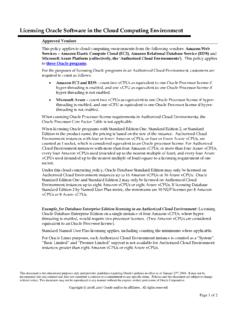
4 Figure 1. oracle BI 12c Data Visualization sample analysis, highlighted trellis chart. 2 | Powerful Visual Analytics FOR THE ENTIRE ORGANIZATION oracle business intelligence 12C O R A C L E D A T A S H E E T K E Y F E A T U R E S Visual Analytics Stunning data visualization. Secure sharing and collaboration. Intelligent highlighting automatically connects related data. Seamless user experience allows intuitive transition from discovery to dashboard. Self-Service Self-service data loading, no modeling required. Self-service blending of personal and corporate data.
5 Automatically inferred connection between data sets. Mobile Touch and voice enabled, literally talk to your data. Full mobile authoring. Adaptive design for any device. Native sharing with other applications for both Android and Apple. Notifications on Android wear and Apple watch. Advanced Analytics Integration with hundreds of free functions. Free R distribution for custom Analytics , no RPD changes required. Performance More in-memory processing In-memory Essbase on Exalytics New Data Sources Direct access to oracle Hyperion application data.
6 Personal self-service data. Direct access to Cloudera Impala. Easy Upgrade One file (BAR) for upgrade, backup, restore, recovery. Free Baseline Validation Tool Stunning, smart visualizations. Visualizing data is as easy as dragging attributes onto the screen. Optimal visualizations are automatically displayed based on the type of data selected, with no upfront configuration, and are also positioned automatically without requiring precise placement so you get started analyzing right away, rather than spending your time configuring graphs, charts, and layouts.
7 It s just as easy to adjust layout and change the visualization type, so you always have control over the display. Everything connected. Visualizations and data are all connected by default, which means highlighting data in one Visual automatically highlights correlated data in every other, immediately showing new patterns. The overall experience is richly dynamic, with visualizations functioning as filters that work in combination with guided navigation and search, keeping your context and helping guide you through your exploration much as you would expect in any online consumer experience.
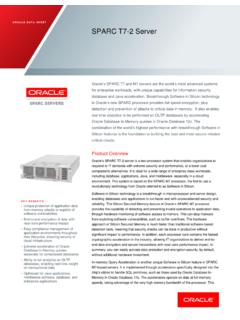
8 Ease-of-use. Updates throughout the platform blend ease-of-use and efficiency with Powerful Analytics capabilities. The interface for the homepage, Answers (ad hoc query and reporting), and Dashboards (analyses and dashboarding) has a simplified structure, more open space, and a cleaner approach to nesting and borders, helping you focus on the data and quickly see what s important. HTML-5 graphics improve view rendering and visualization display; and it s easier for you to create new groups, calculations, and measures, for simpler, more direct interaction with results.
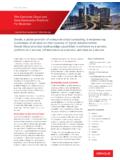
9 Figure 2. oracle BI 12c interface enhancements. Self-Service In addition to sophisticated data integration and modeling capabilities that power ongoing operational analysis, BI 12c offers new self-service capabilities for loading and blending data, with no modeling required making fast analysis available to anyone in the organization. Data loading. You can now simply browse to personal text files and spreadsheets, then click to see a preview and upload them. Mashup. You can easily blend personal data with managed data BI 12c automatically infers connections between data sets, as well as providing an intuitive user experience for redefining connections and creating new ones.
10 Combining data sets gives you the ability to enhance existing managed subject areas by extending dimensions and adding facts, for increasingly timely and relevant analysis. 3 | Powerful Visual Analytics FOR THE ENTIRE ORGANIZATION oracle business intelligence 12C O R A C L E D A T A S H E E T O R A C L E B U S I N E S S I N T E L L I G E N CE 12C oracle business intelligence 12c is the foundation of oracle s complete Analytics solution, available on-premises and in the Cloud for seamless analysis in any environment.