Transcription of Ordinal Regression - norusis.com
1 Chapter 4. Ordinal Regression Many variables of interest are Ordinal . That is, you can rank the values, but the real distance between categories is unknown. Diseases are graded on scales from least severe to most severe. Survey respondents choose answers on scales from strongly agree to strongly disagree. Students are graded on scales from A to F. You can use Ordinal categorical variables as predictors, or factors, in many statistical procedures, such as linear Regression . However, you have to make difficult decisions. Should you forget the ordering of the values and treat your categorical variables as if they are nominal? Should you substitute some sort of scale (for example, numbers 1 to 5) and pretend the variables are interval? Should you use some other transformation of the values hoping to capture some of that extra information in the Ordinal scale? When your dependent variable is Ordinal you also face a quandary. You can forget about the ordering and fit a multinomial logit model that ignores any ordering of the values of the dependent variable.
2 You fit the same model if your groups are defined by color of car driven or severity of a disease. You estimate coefficients that capture differences between all possible pairs of groups. Or you can apply a model that incorporates the Ordinal nature of the dependent variable. The SPSS Ordinal Regression procedure, or PLUM (Polytomous Universal Model), is an extension of the general linear model to Ordinal categorical data. You can specify five link functions as well as scaling parameters. The procedure can be used to fit heteroscedastic probit and logit models. 69. 70. Chapter 4. Fitting an Ordinal Logit Model Before delving into the formulation of Ordinal Regression models as specialized cases of the general linear model, let's consider a simple example. To fit a binary logistic Regression model, you estimate a set of Regression coefficients that predict the probability of the outcome of interest. The same logistic model can be written in different ways.
3 The version that shows what function of the probabilities results in a linear combination of parameters is ln ---------------------------------------- - = 0 + 1 X 1 + 2 X 2 + + k X k prob(event). ( 1 prob(event) ) . The quantity to the left of the equal sign is called a logit. It's the log of the odds that an event occurs. (The odds that an event occurs is the ratio of the number of people who experience the event to the number of people who do not. This is what you get when you divide the probability that the event occurs by the probability that the event does not occur, since both probabilities have the same denominator and it cancels, leaving the number of events divided by the number of non-events.) The coefficients in the logistic Regression model tell you how much the logit changes based on the values of the predictor variables. When you have more than two events, you can extend the binary logistic Regression model, as described in Chapter 3.
4 For Ordinal categorical variables, the drawback of the multinomial Regression model is that the ordering of the categories is ignored. Modeling Cumulative Counts You can modify the binary logistic Regression model to incorporate the Ordinal nature of a dependent variable by defining the probabilities differently. Instead of considering the probability of an individual event, you consider the probability of that event and all events that are ordered before it. Consider the following example. A random sample of Vermont voters was asked to rate their satisfaction with the criminal justice system in the state (Doble, 1999). They rated judges on the scale: Poor (1), Only fair (2), Good (3), and Excellent (4). They also indicated whether they or anyone in their family was a crime victim in the last three years. You want to model the relationship between their rating and having a crime victim in the household. 71. Ordinal Regression Defining the Event In Ordinal logistic Regression , the event of interest is observing a particular score or less.
5 For the rating of judges, you model the following odds: 1 = prob(score of 1) / prob(score greater than 1). 2 = prob(score of 1 or 2) / prob(score greater than 2). 3 = prob(score of 1, 2, or 3) / prob(score greater than 3). The last category doesn't have an odds associated with it since the probability of scoring up to and including the last score is 1. All of the odds are of the form: j = prob( score j ) / prob(score > j). You can also write the equation as j = prob( score j ) / (1 prob( score j )), since the probability of a score greater than j is 1 probability of a score less than or equal to j. Ordinal Model The Ordinal logistic model for a single independent variable is then ln( j ) = j X. where j goes from 1 to the number of categories minus 1. It is not a typo that there is a minus sign before the coefficients for the predictor variables, instead of the customary plus sign. That is done so that larger coefficients indicate an association with larger scores.
6 When you see a positive coefficient for a dichotomous factor, you know that higher scores are more likely for the first category. A negative coefficient tells you that lower scores are more likely. For a continuous variable, a positive coefficient tells you that as the values of the variable increase, the likelihood of larger scores increases. An association with higher scores means smaller cumulative probabilities for lower scores, since they are less likely to occur. Each logit has its own j term but the same coefficient . That means that the effect of the independent variable is the same for different logit functions. That's an assumption you have to check. That's also the reason the model is also called the proportional odds model. The j terms, called the threshold values, often aren't of much interest. Their 72. Chapter 4. values do not depend on the values of the independent variable for a particular case. They are like the intercept in a linear Regression , except that each logit has its own.
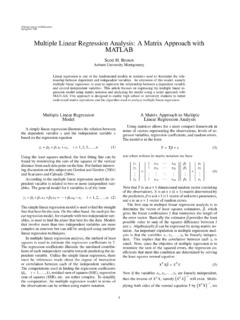
7 They're used in the calculations of predicted values. From the previous equations, you also see that combining adjacent scores into a single category won't change the results for the groups that aren't involved in the merge. That's a desirable feature. Examining Observed Cumulative Counts Before you start building any model, you should examine the data. Figure 4-1 is a cumulative percentage plot of the ratings, with separate curves for those whose households experienced crime and those who didn't. The lines for those who experienced crime are above the lines for those who didn't. Figure 4-1 also helps you visualize the Ordinal Regression model. It models a function of those two curves. Consider the rating Poor. A larger percentage of crime victims than non-victims chose this response. (Because it is the first response, the cumulative percentage is just the observed percentage for the response.) As additional percentages are added (the cumulative percentage for Only fair is the sum of Poor and Only fair), the cumulative percentages for the crime victim households remain larger than for those without crime.
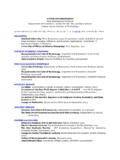
8 It's only at the end, when both groups must reach 100%, that they must join. Because the victims assign lower scores, you expect to see a negative coefficient for the predictor variable, hhcrime (household crime experience). Figure 4-1. Plot of observed cumulative percentages 100. 80. Cumulative percent 60. 40. Anyone in HH. 20 crime victim within past 3. years? Yes 0. No Poor Only fair Good Excellent Rating of judges 73. Ordinal Regression Specifying the Analysis To fit the cumulative logit model, open the file and from the menus choose: Analyze Regression A Dependent: rating A Factors: hhcrime Link: Logit Display ; Goodness of fit statistics ; Summary statistics ; Parameter estimates ; Cell information ; Test of Parallel Lines Saved Variables ; Estimated response probabilities Parameter Estimates Figure 4-2 contains the estimated coefficients for the model. The estimates labeled Threshold are the j 's, the intercept equivalent terms. The estimates labeled Location are the ones you're interested in.
9 They are the coefficients for the predictor variables. The coefficient for hhcrime (coded 1 = yes, 2 = no), the independent variable in the model, is As is always the case with categorical predictors in models with intercepts, the number of coefficients displayed is one less than the number of categories of the variable. In this case, the coefficient is for the value of 1. Category 2. is the reference category and has a coefficient of 0. The coefficient for those whose household experienced crime in the past three years is negative, as you expected from Figure 4-1. That means it's associated with poorer . scores on the rankings of judges. If you calculate e , that's the ratio of the odds for lower to higher scores for those experiencing crime and those not experiencing crime. In this example, exp( ) = This ratio stays the same over all of the ratings. The Wald statistic is the square of the ratio of the coefficient to its standard error.
10 Based on the small observed significance level, you can reject the null hypothesis that 74. Chapter 4. it is zero. There appears to be a relationship between household crime and ratings of judges. For any rating level, people who experience crime score judges lower than those who don't experience crime. Figure 4-2. Parameter estimates 95% Confidence Interval Estimate Std. Error Wald df Sig. Lower Bound Upper Bound Threshold [rating = 1] .152 1 .000 [rating = 2] .091 1 .000 [rating = 3] .172 1 .000 Location [hhcrime=1] .232 1 .006 [hhcrime=2] 01 .. 0 .. Link function: Logit. 1. This parameter is set to zero because it is redundant. Testing Parallel Lines When you fit an Ordinal Regression you assume that the relationships between the independent variables and the logits are the same for all the logits. That means that the results are a set of parallel lines or planes one for each category of the outcome variable. You can check this assumption by allowing the coefficients to vary, estimating them, and then testing whether they are all equal.