Transcription of OTC derivatives statistics at end-December 2017
1 1/11 3 May 2018 Statistical release: OTC derivatives statistics at end-December 2017 The latest BIS over-the-counter (OTC) derivatives statistics refer to end-December 2017. The statistics can be browsed in the BIS statistics Explorer, searched in the BIS statistics Warehouse, viewed as PDF tables or downloaded in a single CSV file. Technical terms are explained in the online glossary. Data are subject to change. Publication dates for revisions and updates are announced in the release calendar. Questions about the BIS OTC derivatives statistics may be addressed to Contents 1. Highlights from the latest statistics .. 2 Notional amount of OTC derivatives little changed in H2 2017.
2 2 Gross market value of interest rate contracts falls to its lowest level since 2007 .. 3 Cleared segment rises to 55% of CDS market .. 4 Revisions to historical data .. 5 2. About the statistics .. 6 Reporting basis .. 6 Reporting countries .. 6 Valuation effects of changes in exchange rates .. 7 Revisions and breaks .. 7 Estimated clearing rate .. 7 Annex: Charts .. 8 2/11 1. Highlights from the latest statistics The gross market value of outstanding OTC derivatives contracts fell to $11 trillion at end-2017, its lowest level since 2007. The share of centrally cleared credit default swaps (CDS) rose to 55% at end-2017, as central clearing made further inroads.
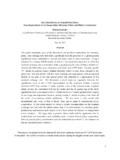
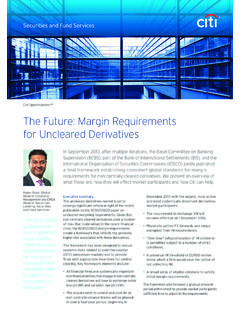
3 The BIS revised the full history of the OTC derivatives statistics to incorporate more data from the Triennial Central Bank Survey. The grand total for all contracts remains unchanged, but amounts for all breakdowns are higher due to the allocation of previously undistributed amounts. Notional amount of OTC derivatives little changed in H2 2017 Graph 1: Notional amounts outstanding, by risk category (interactive graph). Source: BIS OTC derivatives statistics (Table ). Since 2015, the notional amount of outstanding OTC derivatives contracts has fluctuated in a range between about $480 trillion and $550 trillion (Graph 1). Notional amounts re mained in this range in the second half of 2017, ending the year at $532 trillion.
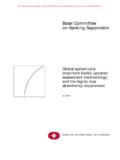
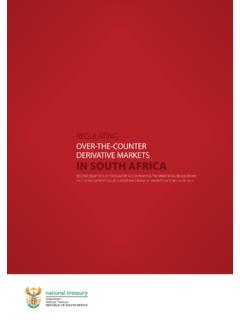
4 In contrast, the gross market value of OTC derivatives , which provides a more meaningful measure of market and counterparty credit risk, continued to decline, from $13 tr illion at end-June 2017 to $11 trillion at end-2017. The last time this value had been so low was end-June 2007. Gross credit exposures, which adjust gross market values for legally enforceable bilateral netting agreements (but not for collateral), also fell to their lowest level since 2007. They declined to $ trillion at end-2017. 3/11 Gross market value of interest rate contracts falls to its lowest level since 2007 Graph 2: Gross market value of OTC interest rate derivatives , by currency (interactive graph).
5 Source: BIS OTC derivatives statistics (Table D7). In notional terms, interest rate contracts dominate OTC derivatives markets, and consequently this segment drives overall activity. The notional amount of outstanding OTC interest rate derivatives was little changed in the second half of 2017, ending 2017 at $427 trillion. Contracts with a maturity of one year or less accounted for the largest share, at $191 trillion, followed by those with a maturity between one and five years ($140 trillion). In contrast to notional amounts, the gross market value of OTC interest rate derivatives fell further in the second half of 2017, to $ trillion also the lowest level since 2007.
6 The amount denominated in all major currencies declined during this period. The decline is likely to have reflected increases in long-term yields, which reduced the gap between market interest rates on the reporting date and those prevailing at contract inception. Taking a longer-term perspective, the market value of US dollar contracts has dropped especially markedly. At end-2011, the gross market value of euro- and US dollar-denominated contracts was similar, at about $ trillion each (Graph 2). By end-2017, that of euro-denominated derivatives had fallen to $ trillion, and that of their US dollar equivalents to as little as $ trillion. At end-2017, the market value of US dollar contracts was not far above that of sterling contracts ($ trillion).
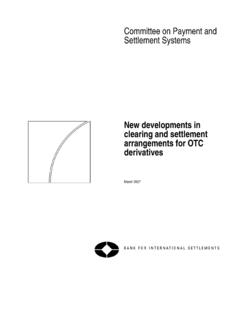
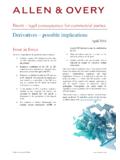
7 4/11 Cleared segment rises to 55% of CDS market Graph 3: Outstanding notional amount of CDS, by sector of counterparty (interactive graph). Source: BIS OTC derivatives statistics (Table ). Central clearing continued to make inroads in OTC derivatives markets. In the CDS market , the cleared segment (blue line in Graph 3) rose from $ trillion to $ trillion in the second half of 2017, even as the notional amount of outstanding CDS declined slightly. Consequently, the share of outstanding CDS cleared through central counterparties (CCPs) increased from 51% at end-June 2017 to 55% at end-December 2017. Bilateral contracts between reporting dealers declined further in the second half of 2017, to $ trillion.
8 These shifts are consistent with the novation to CCPs of contracts between dealers. Turning to OTC interest rate derivatives markets, the share of central clearing has remained roughly stable since comprehensive data on CCPs started to be collected in 2016. Reporting dealers positions booked against CCPs totalled $320 trillion at end-2017, accounting for about 75% of notional amounts outstanding. The share of cleared positions was highest for OTC interest rate derivatives denominated in Canadian dollars, at 88%, and lowest for those in euros, at 72%. In OTC foreign exchange (FX) derivatives markets, only 2% of notional amounts were centrally cleared at end-2017. While the BIS does not collect a decomposition of FX derivatives into FX swaps and forwards, the cleared amounts were probably concentrated in non-deliverable forwards because they are one of the few FX instruments that CCPs offer for clearing.
9 5/11 Revisions to historical data Together with this release, the BIS is revising the full history of the OTC derivatives statistics to incorporate more data from the Triennial Central Bank Survey of foreign exchange and OTC derivatives markets. Since 1998, the BIS has collected two sets of statistics on positions in OTC derivatives markets: semiannual data from large derivatives dealers in 12 jurisdictions, and triennial data from smaller dealers in more than 30 additional jurisdictions (Section 2). As a share of notional amounts outstanding, the data collected in the Triennial Survey fell from a high of 13% of the combined data in 1998 to a low of 4% in 2013 and 6% in 2016.
10 Between Triennial Surveys, the BIS uses the triennial data to scale up the semiannual data, thereby providing a more accurate estimate of the global size of OTC derivatives markets. Previously, the BIS added the triennial data to the semiannual total for all contracts but did not allocate the triennial data across risk categories, ie the scaled-up estimates were published as unallocated amounts. Starting with this release and backdated to 1998, the BIS now allocates the scaled-up amounts across risk categories, instruments, counterparties, currencies and maturities. The total for all contracts remains unchanged, but amounts for all breakdowns are higher because of the redistribution of previously unallocated amounts.