Transcription of Overview & Methods
1 Overview & Methods 2017: The Big Picture 21 Game-Changing Kid & Family Trends Little Voices, Big Change 7. Rise of the SuperHERoes 9. A New Genderation 13. Welcome to My YOUniverse 16. Hey, Guys! 18. The Main Stream 20. Me, Myself and My 23. Language Arts 25. Snap Happy 27. Flipping the Switch 31. Amazon and On and On 33. A. I. A. I. Oh! 37. VR the World 39. AR So Far 42. The Next Sensation 44. Challenging Times 47. Kickin' It Old School 49. Cleaning Our Plates 51. Let Them Eat Cake Candy 54. Hungry for Fun 57. Rainbows and Unicorns 59. Appendix 61. Welcome to the 2017 KID & FAMILY TRENDS fielded online with a nationally-representative REPORT, a comprehensive look at the macro- sample of over 8,200 kids and tweens ages 6.
2 And micro-trends driven by and impacting to 12 and their parents. Data collection took kids and their families. place in June and July in order to capture both school year and summer learning. The report published by SMARTY PANTS . youth and family research firm is derived from Kids and parents evaluated a total of 347. national news, case studies, primary qualitative brands across 20 categories. Each participant research , and quantitative findings from the assessed up to 15 brands, providing both 2017 BRAND LOVE study. closed and open-ended responses. BRAND LOVE is a proprietary study of the . lifestyles and behaviors of kids and tweens . ages 6-12.
3 The study also covers their awareness, affinity, perceptions and usage of . hundreds of family-facing brands. Parents of 6. to 12-year-olds evaluate the same brands, . providing a holistic look at families with . children.. The 2017 wave of the annual study its 9th was 3. Closed-ended responses included rating each Kids and tweens also rated how popular they brand on 30 attributes & descriptors: perceive a brand to be. The results aid in mapping each brand's momentum. I can make it my own/personalize it (Customization). Active/physical Good for me/healthy/safe Two proprietary measures are referenced A good value throughout the report: I can buy it with my own $ (Affordable).
4 Made well/good quality (High-Quality) KIDFINITY is an aggregate measure of Been around a long time (Heritage). kids' brand awareness, love and popularity perceptions. Composite scores Has great varieties/options range from 0 to 1000, with most brands Easy to use/do/make scoring between 400 and 900 points. Has great commercials/advertisements PARENTFINITY is a similar, independent Has a great website composite metric that factors in Has a great app parents' brand awareness and love. Scores Does good things for the environment/world also range from 0 to 1000. Convenient/portable Both measures have a .86+ correlation to Exciting/adventurous current and future usage, making them critical Tastes great indicators of brand success.
5 For whole family (All-Family). For kids my age Brands can be ranked based on their KIDFINITY and PARENTFINITY scores. Note For kids younger than me that absolute scores are a truer indicator of For kids older than me YOY brand performance, since rankings can Good for connecting with others (Social) be impacted by the number of brands and the My mom/dad let me have/use it (Allowed) actual brands included in the study each year. Challenges/educates me Gives me rewards/rewards me Innovative/always has new things Fun Different/unique Cool/trendy Looks good/good design Note that me is replaced with my Hard to get/find (Elusive) child for parents An analysis of these attributes leads to a deeper understanding of how brands perform and All brands referenced in report in bold blue categories behave.
6 Are part of the 2017 BRAND LOVE study. 4. If you ask kids and parents to write the each other's worlds. Symbols are dominating headlines for 2017, they might offer funny everyday language. Kids are #shipping at an captions like: earlier age (relationship-ing, that is). And songs like Despacito the summer anthem 2017: Put the Fidget Spinners DOWN of the year are taking over families' cars and 2017: I Better Not Find that Slime on the tablets. 2017: More YouTube and Netflix, please! . 2017: I'm with Wonder Woman In many ways, 2017 has also been a year of paradoxes. News has been much more black Or perhaps, they'd begin to lament a year and white, red and blue, us and them.
7 At the where our nation but not families has been same time, Americans are more connected more divided than ever. than ever digitally and emotionally. Indeed, 2017 has been a year of great change While AI, VR, AR and MR have catapulted and big movements. A new president is now technology to a place families never new they in office. Women's narratives and journeys are could go, they are also unplugging, getting the spotlight. Amazon has officially reconnecting and enjoying the basics of face- changed the face of the retail landscape as to-face interactions. It's the year of the future well as our shopping expectations. Netflix has and the year of the past.
8 Done the same for entertainment. And YouTube continues to invite users into Health has become a huge priority, and the 5. quest for whole, natural and pure has never So, dive in. Take a look at what has changed been greater. One day Panera's CEO is in American kids' and families' lives over the challenging QSR CEOs to eat their own kids' past 12 months, and perhaps more meal and make a change. The next day importantly where these phenomena are tweens and parents are introduced to a taking the youth and family market in colorful, unicorn Frappuccino with much coming years. delight. Happy reading! It's a lot to digest. We're not just seeing this tug-of-war in the headlines.
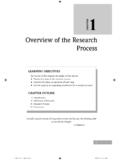
9 The findings from the BRAND. LOVE study bear these dualities as well. We've packaged the biggest ones here. This year, THE KID AND FAMILY TRENDS. REPORT reviews 21 trends in the kid and family space. As you read, take note of pervasive themes that continue to color the landscape of families with children ages 6-12, like: Parent-child convergence Empowerment Gender confluence Hyper-personalization Quantification Simplicity Connection Fascination and many more. 6. For the second year in a row, YouTube leads all A whopping 96% of kids ages 6-12 are aware 347 cross-category brands evaluated in the of YouTube, and 94% say they either love BRAND LOVE study, solidifying its position as (71%) or like (24%) it!
10 With awareness and the most powerful brand in kids' lives. love comes usage. In 2017, 90% of kids who know the brand say they use it, 83% of whom The platform's ascent to the top is impressive, do so daily. moving from a KIDFINITY score of 749 (and #86. ranking) in 2010 to the #1 brand that is The frequency of YouTube engagement disseminating trends, changing play patterns, continues to rise. This year, 65% of kid users and transforming the ways kids come of age. use the app/site several times a day up 20. percentage points since 2015. Change in YouTube KIDFINITY. 900. Change in Kid Usage of YouTube 869 Several Times Per Day 858 852. 846 844 65%. 54%.