Transcription of Overview of Ground Water in India - PRS
1 Overview ofGround Water in IndiaRoopal Suhag February 20161 The Standing Committee on Water Resources examined the subject Review of Ground Water scenario, need for a comprehensive policy and measures to address problems in the country with particular reference to (i) dark blocks, and (ii) contamination of underground Water by certain industries and submitted their report in December 2015. The Committee s recommendations are summarised in the annexure to the note. Committees usually review the action taken by the government on their recommendations, a few months after the report is released. In this context, we present an analysis of the Ground Water scenario in the country. This note maps the indicators regarding availability of Ground Water in the country, the policy framework and some key issues with regard to the sector. Overview of Ground Water in India Introduction Ground Water is the Water that seeps through rocks and soil and is stored below the Ground .
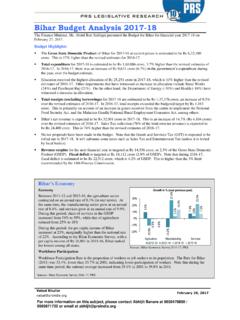
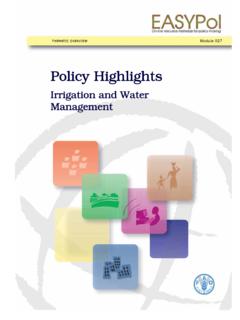
2 The rocks in which Ground Water is stored are called aquifers. Aquifers are typically made up of gravel, sand, sandstone or limestone. Water moves through these rocks because they have large connected spaces that make them permeable. The area where Water fills the aquifer is called the saturated zone. The depth from the surface at which Ground Water is found is called the Water table. The Water table can be as shallow as a foot below the Ground or it can be a few hundred meters deep. Heavy rains can cause the Water table to rise and conversely, continuous extraction of Ground Water can cause the level to fall. Figure 1 illustrates the major definitions used in the context of groundwater. Figure 1: Graphical representation of Ground Water and associated terms The underground (hydrogeological) setting of Ground Water defines the potential of this resource and its vulnerability to irreversible This setting in India can be divided into following categories, which are described below: Hard-rock aquifers of peninsular India : These aquifers represent around 65% of India s overall aquifer surface area.
3 Most of them are found in central peninsular India , where land is typically underlain by hard-rock formations. These rocks give rise to a complex and extensive low-storage aquifer system, where in the Water level tends to drop very rapidly once the Water table falls by more than 2-6 meters. Additionally, these aquifers have poor permeability* which limits their recharge through rainfall. This implies that Water in these aquifers is non- replenishable and will eventually dry out due to continuous usage. * Permeability refers to the ability of a rock to transmit Water . 2 Alluvial aquifers of the Indo-Gangetic plains: These aquifers, found in the Gangetic and Indus plains in Northern India have significant storage spaces, and hence are a valuable source of fresh Water supply. However, due to excessive Ground Water extraction and low recharge rates, these aquifers are at the risk of irreversible overexploitation.
4 Ground Water availability As of April 2015, the Water resource potential or annual Water availability of the country in terms of natural runoff (flow) in rivers is about 1,869 Billion Cubic Meter (BCM) However, the usable Water resources of the country have been estimated as 1,123 BCM/year. This is due to constraints of topography and uneven distribution of the resource in various river basins, which makes it difficult to extract the entire available 1,869 BCM/year. Out of the 1,123 BCM/year, the share of surface Water and Ground Water is 690 BCM/year and 433 BCM/year respectively. Setting aside 35 BCM for natural discharge*, the net annual Ground Water availability for the entire country is 398 The overall contribution of rainfall to the country s annual Ground Water resource is 68% and the share of other resources, such as canal seepage, return flow from irrigation, recharge from tanks, ponds and Water conservation structures taken together is 32%.
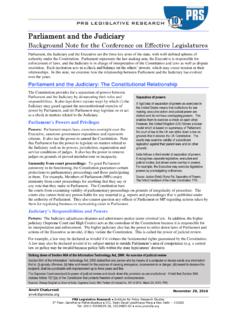
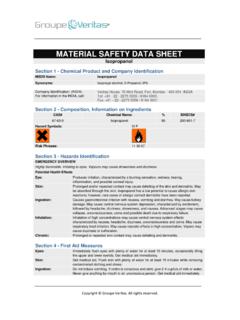
5 4 Due to the increasing population in the country, the national per capita annual availability of Water has reduced from 1,816 cubic metre in 2001 to 1,544 cubic metre in This is a reduction of 15%. Figure 2: Depth to Water level (pre-monsoon, 2014) Note: m bgl denotes meters below Ground level. Sources: Central Ground Water Board; PRS. The figure indicates that Ground Water is available at a lower level in the north-western region of the country. There are other significant pockets across the country where the depth of the Water level is more than 10 metres. This implies that one has to dig deeper to reach the Water table in these regions. When the Ground Water level crosses 10 metres, sophisticated equipment is required to extract it. * Natural discharge occurs as seepage to Water bodies or oceans in coastal areas and as transpiration by plants whose roots extend up to the Water table.
6 Table 1: Statistics regarding Water resources in India Parameter Unit (Billion Cubic Meter/Year) Annual Water availability 1,869 Usable Water 1,123 Surface Water 690 Ground Water 433 Sources: Water and Related Statistics, April 2015, Central Water Commission; PRS. 3 Ground Water resources in the country are assessed at different scales within districts, such as blocks/mandals/talukas/watersheds. Ground Water development is a ratio of the annual Ground Water extraction to the net annual Ground Water availability. It indicates the quantity of Ground Water available for use. Table 2 below compares the level of Ground Water development in the country over the past two decades. Table 2: Comparative status of level of Ground Water development in India in the past 20 years Level of Ground Water development Explanation % of districts in 1995 % of districts in 2004 % of districts in 2009 % of districts in 2011 0-70% (Safe) Areas which have Ground Water potential for development 92 73 72 71 70-90% (Semi-critical) Areas where cautious Ground Water development is recommended 4 9 10 10 90-100% (Critical) Areas which need intensive monitoring and evaluation for Ground Water development 1 4 4 4 >100% (Over-exploited) Areas where future Ground Water development is linked with Water conservation measures 3 14 14 15 Sources: Central Ground Water Board; PRS.
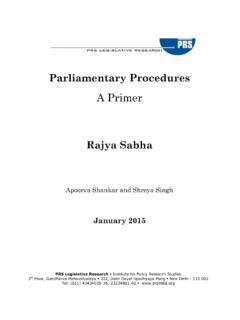
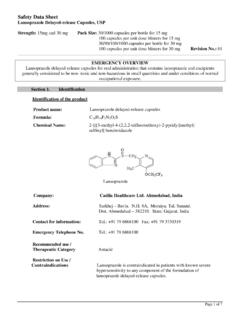
7 Figure 3: Categorization of Ground Water assessment units State Ground Water development in 2011 (%) Andhra Pradesh 37 Arunachal Pradesh 0 Assam 14 Bihar 44 Chhattisgarh 35 Delhi 137 Goa 28 Gujarat 67 Haryana 133 Himachal Pradesh 71 Jammu & Kashmir 21 Jharkhand 32 Karnataka 64 Kerala 47 Madhya Pradesh 57 Maharashtra 53 Manipur 1 Meghalaya 0 Mizoram 3 Nagaland 6 Odisha 28 Puducherry 90 Punjab 172 Rajasthan 137 Sikkim 26 Tamil Nadu 77 Telangana 55 Tripura 7 Uttar Pradesh 74 Uttarakhand 57 West Bengal 40 Total * 62 Note: *Total includes union territories. Note: Data as of 2011. Sources: Ground Water scenario in India , November 2014, Central Ground Water Board; PRS. 4 The level of Ground Water development is very high in the states of Delhi, Haryana, Punjab and Rajasthan, where Ground Water development is more than 100%. This implies that in these states, the annual Ground Water consumption is more than annual Ground Water recharge.
8 In the states of Himachal Pradesh, Tamil Nadu and Uttar Pradesh and the Union Territory of Puducherry, the level of Ground Water development is 70% and above. In rest of the states, the level of Ground Water development is below 70%. Over the years, usage of Ground Water has increased in areas where the resource was readily This has resulted in an increase in overall Ground Water development from 58% in 2004 to 62% in 2011, as illustrated in Figure 3. Ground Water extraction and use Experts believe that India is fast moving towards a crisis of Ground Water overuse and Ground Water overuse or overexploitation is defined as a situation in which, over a period of time, average extraction rate from aquifers is greater than the average recharge rate. In India , the availability of surface Water is greater than Ground Water . However, owing to the decentralised availability of groundwater*, it is easily accessible and forms the largest share of India s agriculture and drinking Water supply.
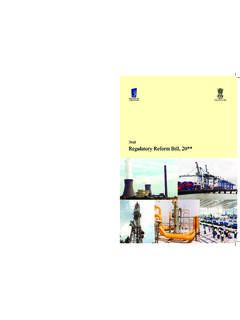
9 89% of Ground Water extracted is used in the irrigation sector, making it the highest category user in the This is followed by Ground Water for domestic use which is 9% of the extracted groundwater. Industrial use of Ground Water is 2%. 50% of urban Water requirements and 85% of rural domestic Water requirements are also fulfilled by Ground Irrigation through Ground Water The largest component of Ground Water use is the Water extracted for irrigation. The main means of irrigation in the country are canals, tanks and wells, including tube-wells. Of all these sources, Ground Water constitutes the largest share. Wells, including dug wells, shallow tube-wells and deep tube wells provide about of Water for irrigation, followed by canals with Over the years, there has been a decrease in surface Water use and a continuous increase in Ground Water utilisation for irrigation. Figure 5 illustrates the pattern of use of the main sources of irrigation.
10 As can be seen, the share of tubewells has increased exponentially, indicating the increased usage of Ground Water for irrigation by farmers. The dependence of irrigation on Ground Water increased with the onset of the Green Revolution, which depended on intensive use of inputs such as Water and fertilizers to boost farm Incentives such as credit for irrigation equipment and subsidies for electricity supply have further worsened the Low power tariffs has led to excessive Water usage, leading to a sharp fall in Water Figure 4: Increase in Ground Water utilization for irrigation Figure 5: Tubewells increasingly being the main source of irrigation Sources: Agricultural Statistics at Glance 2014, Ministry of Agriculture; PRS. Note: Irrigated area is in 000 hectares. Source: Agricultural Statistics at Glance 2014, Ministry of Agriculture; PRS. * Decentralised availability of Ground Water implies that the owner of a piece of land has the right to the Water under it according to the Easement Act of 1884.