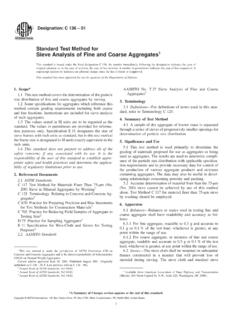
Transcription of Overview - Pharmahub
1 Sieve Analysis Overview Sieve analysis is a technique used to determine the particle size distribution of a powder. This method is performed by sifting a powder sample through a stack of wire mesh sieves, separating it into discrete size ranges. A sieve shaker is used to vibrate the sieve stack for a specific period of time. Vibration allows irregularly shaped particles to reorient as they fall through the sieves. Additionally, agitation of the sieves serves to break apart weak agglomerates, allowing for a more reliable measurement of the particle size distribution. Care should be taken to choose an appropriate agitation time, so that particle fracture does not occur. The particle size distribution of a powder serves as an indication of flowability.
2 Powders with a broad size distribution tend to be poorer flowing than those with a narrow size distribution. Figure 1: Example image of sieve shaker equipment and wire cloth sieves ASTM Standard Testing Procedure ASTM B214-07: Standard Test Method for Sieve Analysis of Metal Powders details sample preparation, procedure, and results reporting specifications for sieve analysis of metal powders. These specifications can be extended for use with testing of pharmaceutical excipients. Test Specimen The ASTM standard provides a recommendation on the size of the sample used in sieve analysis. If the apparent density of the powder is larger than g/cm3, a sample size between 90-110g should be used. Otherwise, a smaller sample between 40-60g may be used.
3 Procedure 1. Record the mass of the sample to be used. 2. Stack sieves in order from smallest to largest, starting at the bottom, with the pan below the smallest sieve. 3. Add the powder sample to the top sieve. 4. Tighten the equipment to ensure that the sieve stack is held firmly in the shaker assembly. 5. Set the sieve shaker to vibrate for 15 minutes. A shorter time may be required for brittle materials. Results 1. Carefully weigh the mass retained on each sieve and in the pan. 2. Organize the results in a table which provides columns for sieve number, sieve size, mass fraction retained. a. The mass fraction is defined as the mass retained on a particular sieve divided by the initial sample mass. Sieve Number Sieve Size Mass Percentage Retained (%).
4 14 1400 18 1000 25 710 35 500 40 425 Pan 0 Figure 2: Example Data USP-NF Standard Testing Procedure Chapter <786> of USP32-NF27 provides a description of the testing method for the measurement of particle size distribution of a powder by the sieve analysis method. While this standard does not provide a specific testing procedure, it does specify requirements for operating parameters and the selection of a dispersant fluid. These requirements are as follows. 1. This method is appropriate for particle sizes larger than 75 m. Smaller particle sizes may be used through the addition of an agitation method such as air jet or sonic sieving. In addition, if particle sizes smaller than this value are used, a validation of the method for use with the target particle size should be provided in the results report.
5 2. Sample mass should be between 25 and 100g. 3. Temperature and humidity should be controlled such that the moisture content of the material remains constant. 4. Appropriate sieve sizes should be selected to cover the range of particle sizes in the sample. 5. Sieves should be inspected for cleanliness and defects prior to use. 6. Test sieves should be 200mm in diameter. a. For smaller samples, smaller sieves may be used. b. Small samples may need to be used for particles with low apparent density. 7. An appropriate agitation method should be selected based on the material under consideration. Reporting The USP-NF standard requires that the following information be reported for this test method: 1. Sample mass 2. Sieve time 3. Sieve method 4.
6 Mass retained on each sieve 5. If it is necessary to calculate a cumulative size distribution finer, an upper sieve should be selected through which the entire sample will pass (0% retained). Calculation of Distributions and Associated Parameters The frequency distribution and the cumulative frequency distribution are two widely used methods of representing particle size data. The following outlines the method of calculating these two distributions from sieve analysis data, as well as several associated parameters. Frequency Distribution A frequency distribution derived from sieve analysis data consists of a plot of the frequency by mass of discrete size intervals (fmi) against the midpoint of the interval size (xmid). This plot can be represented either as a scatter plot or as a histogram.
7 The following is a description of how to calculate the frequency distribution of a powder from sieve analysis data. Figure 3. Notation 1. fmi the frequency, by mass, of interval i [%/ m]. 2. y%mi the mass percentage retained in size interval i [%]. 3. xmidi the midpoint of size interval i [ m]. 4. xi the width of size interval i [ m]. 5. xi the size of the current sieve [ m]. Equations Cumulative Distribution A cumulative distribution derived from sieve analysis data consists of plotting the cumulative mass percentage finer against the midpoint of each size interval. This type of plot is typically represented as a scatter plot. The cumulative mass percentage finer is the sum of all mass percentages in size ranges smaller than and including the current size range.
8 The following is a description of the calculations required to obtain this distribution from sieve analysis data. Figure 4. Notation 1. Cmi Cumulative mass percentage finer in size interval i [%]. 2. y%mi the mass percentage retained in size interval i [%]. 3. xmidi the midpoint of size interval i [ m]. 4. xi the width of size interval i [ m]. 5. xi the size of the current sieve [ m]. Sieve Size ( m) Midpoint of Size Mass Percentage Cumulative Mass Interval ( m) Retained (%) Percentage Finer (%). 1400 1600 1000 1200 710 855 500 605 425 0 Table 1: Example Data Mass Mean Diameter (x4,3). Notation 1. the midpoint of the size range in a (size, frequency) pair [ m]. 2. y%mi mass percentage in size range [%]. Sauter Mean Diameter (x3,2). Notation 1.
9 The midpoint of the size range in a (size, frequency) pair [ m]. 2. y%mi mass percentage in size range [%]. x10. This quantity is often found by interpolation, using the cumulative size distribution. The 10th percentile size is defined as the particle size at which 10% of particles are smaller. Notation 1. f(x) frequency distribution [%/ m]. 2. cumulative distribution [%]. Median (x50). This quantity is often found by interpolation, using the cumulative size distribution. The 50th percentile size is the particle size at which 50% of particles are smaller. Notation 1. f(x) frequency distribution [%/ m]. 2. cumulative distribution [%]. x90. This quantity is often found by interpolation, using the cumulative size distribution. The 90th percentile size is the particle size at which 90% of particles are smaller.
10 Notation 1. f(x) frequency distribution [%/ m]. 2. cumulative distribution [%]. Spa