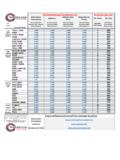
Transcription of P3 Trades Form
1 P3 System Charts | Wendy Kirkland 2017 P3 Trades form I believe that it is the artist in me that allows me to see patterns differently on the equity price charts. The P3 Squeeze pattern is formed by two unrelated indicators. Truly, they have nothing to do with each other, and yet, in a fortuitous discovery, I found that when they are placed on top of each other, they create a pattern when accompanied by other confirmations that shows when an equity is ready to burst upward. The most profitable Trades , hands-down, are those that have experienced a pullback, find a bottom, reverse, and then confirm an entry signal. The P3 pattern and its stages check off all those boxes. P3 System Charts | Wendy Kirkland 2017 Once the indicators squeeze together to create the squeeze pattern, it goes through several recognizable pattern stages that tell the trader when the pattern is ready for entry, in trouble, resting, building up speed, and when to exit.
2 When you read my book, you ll know more about how to recognize these stages when you see them. It all starts with a pattern that is easy to recognize when you know what you are looking for.. P3 System Charts | Wendy Kirkland 2017 P3 System Charts | Wendy Kirkland 2017 P3 System Charts | Wendy Kirkland 2017