Transcription of Pearson Edexcel Cenre uer Cnte uer International Advanced ...
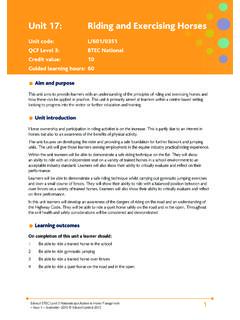
1 Please check the examination details below before entering your candidate informationCandidate surnameOther namesTotal MarksCentre NumberCandidate Number*P54879A0120*P54879A 2019 Pearson Education over Candidates may use any calculator allowed by the regulations of the Joint Council for Qualifications. Calculators must not have the facility for symbolic algebra manipulation, differentiation and integration, or have retrievable mathematical formulae stored in them. Instructions Use black ink or ball-point pen. If pencil is used for diagrams /sketches /graphs it must be dark (HB or B). Coloured pencils and highlighter pens must not be used. Fill in the boxes at the top of this page with your name, centre number and candidate number. Answer all questions and ensure that your answers to parts of questions are clearly labelled.
2 Answer the questions in the spaces provided there may be more space than you need. You should show sufficient working to make your methods clear. Answers without working may not gain full credit. Values from the statistical tables should be quoted in full. When a calculator is used, the answer should be given to an appropriate degree of The total mark for this paper is 75. The marks for each question are shown in brackets use this as a guide as to how much time to spend on each Read each question carefully before you start to answer it. Try to answer every question. Check your answers if you have time at the (Time: 1 hour 30 minutes)Paper Reference WST01/01 You must have:Mathematical Formulae and Statistical Tables (Blue)Statistics S1 Advanced / Advanced SubsidiaryThursday 17 January 2019 Pearson Edexcel InternationalAdvanced Level DO NOT WRITE IN THIS AREA DO NOT WRITE IN THIS AREA DO NOT WRITE IN THIS AREAL eave blank2*P54879A0220* DO NOT WRITE IN THIS AREA DO NOT WRITE IN THIS AREA DO NOT WRITE IN THIS AREA1.
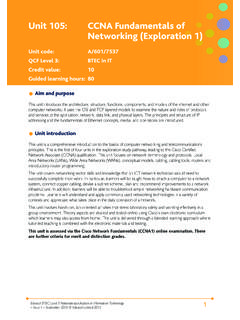
3 The Venn diagram shows the probability of a randomly selected student from a school being in the sets L, B and C, where L represents the event that the student has instrumental music lessons B represents the event that the student plays in the school band C represents the event that the student sings in the school choir p, q, r and s are (a) Select a pair of mutually exclusive events from L, B and C.(1) Given that P(L) = , P(B) = , P(C) = and the events L and C are independent, (b) find the value of p,(2) (c) find the value of q, the value of r and the value of s.(3) A student is selected at random from those who play in the school band or sing in the school choir. (d) Find the exact probability that this student has instrumental music lessons.
4 (3)_____Leave blank3 Turn over*P54879A0320* DO NOT WRITE IN THIS AREA DO NOT WRITE IN THIS AREA DO NOT WRITE IN THIS AREA DO NOT WRITE IN THIS AREA DO NOT WRITE IN THIS AREA DO NOT WRITE IN THIS AREAQ uestion 1 continued_____Q1(Total 9 marks) DO NOT WRITE IN THIS AREA DO NOT WRITE IN THIS AREA DO NOT WRITE IN THIS AREAL eave blank4*P54879A0420* DO NOT WRITE IN THIS AREA DO NOT WRITE IN THIS AREA DO NOT WRITE IN THIS AREA2. The discrete random variable X has the following probability 2 1 013P(X = x) (a) Find E(X).(2) Given that E(X 2) = (b) find the value of a and the value of b.(5) The random variable Y = 3 2X (c) Find Var(Y ).(3)_____Leave blank5 Turn over*P54879A0520* DO NOT WRITE IN THIS AREA DO NOT WRITE IN THIS AREA DO NOT WRITE IN THIS AREA DO NOT WRITE IN THIS AREA DO NOT WRITE IN THIS AREA DO NOT WRITE IN THIS AREAQ uestion 2 continued_____Q2(Total 10 marks) DO NOT WRITE IN THIS AREA DO NOT WRITE IN THIS AREA DO NOT WRITE IN THIS AREAL eave blank6*P54879A0620* DO NOT WRITE IN THIS AREA DO NOT WRITE IN THIS AREA DO NOT WRITE IN THIS AREA3.
5 The weights of women boxers in a tournament are normally distributed with mean 64 kg and standard deviation 8 kg. (a) Find the probability that a randomly chosen woman boxer in the tournament weighs less than 51 kg.(3) In the tournament, women boxers who weigh less than 51 kg are classified as lightweight. Ren weighs 49 kg and she has a match against another randomly selected, lightweight woman boxer. (b) Find the probability that Ren weighs less than the other boxer.(4) In the tournament, women boxers who weigh more than H kg are classified as heavyweight. Given that 10% of the women boxers in the tournament are classified as heavyweight, (c) find the value of H.(3)_____Leave blank7 Turn over*P54879A0720* DO NOT WRITE IN THIS AREA DO NOT WRITE IN THIS AREA DO NOT WRITE IN THIS AREA DO NOT WRITE IN THIS AREA DO NOT WRITE IN THIS AREA DO NOT WRITE IN THIS AREAQ uestion 3 continued_____Q3(Total 10 marks) DO NOT WRITE IN THIS AREA DO NOT WRITE IN THIS AREA DO NOT WRITE IN THIS AREAL eave blank8*P54879A0820* DO NOT WRITE IN THIS AREA DO NOT WRITE IN THIS AREA DO NOT WRITE IN THIS AREA4.
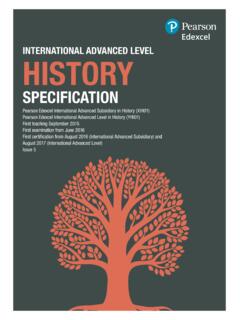
6 A group of 100 adults recorded the amount of time, t minutes, they spent exercising each day. Their results are summarised in the table (t minutes)Frequency (f)Time midpoint (x) 0 t < t < t < 602845 60 t < 1202490120 t 2406180[You may use f x2 = 455 ] A histogram is drawn to represent these data. The bar representing the time 0 t < 15 has width cm and height 6 cm. (a) Calculate the width and height of the bar representing a time of 60 t < 120(3) (b) Use linear interpolation to estimate the median time spent exercising by these adults each day.(2) (c) Find an estimate of the mean time spent exercising by these adults each day.(2) (d) Calculate an estimate for the standard deviation of these times.(2) (e) Describe, giving a reason, the skewness of these data.(1) Further analysis of the above data revealed that 18 of the 25 adults in the 0 t < 15 group took no exercise each day.
7 (f) State, giving a reason, what effect, if any, this new information would have on your answers to (i) the estimate of the median in part (b), (ii) the estimate of the mean in part (c), (iii) the estimate of the standard deviation in part (d).(3)Leave blank9 Turn over*P54879A0920* DO NOT WRITE IN THIS AREA DO NOT WRITE IN THIS AREA DO NOT WRITE IN THIS AREA DO NOT WRITE IN THIS AREA DO NOT WRITE IN THIS AREA DO NOT WRITE IN THIS AREAQ uestion 4 continued_____ DO NOT WRITE IN THIS AREA DO NOT WRITE IN THIS AREA DO NOT WRITE IN THIS AREAL eave blank10*P54879A01020* DO NOT WRITE IN THIS AREA DO NOT WRITE IN THIS AREA DO NOT WRITE IN THIS AREAQ uestion 4 continued_____Leave blank11 Turn over*P54879A01120* DO NOT WRITE IN THIS AREA DO NOT WRITE IN THIS AREA DO NOT WRITE IN THIS AREA DO NOT WRITE IN THIS AREA DO NOT WRITE IN THIS AREA DO NOT WRITE IN THIS AREAQ uestion 4 continued_____Q4(Total 13 marks)
8 DO NOT WRITE IN THIS AREA DO NOT WRITE IN THIS AREA DO NOT WRITE IN THIS AREAL eave blank12*P54879A01220* DO NOT WRITE IN THIS AREA DO NOT WRITE IN THIS AREA DO NOT WRITE IN THIS AREA5. Some children are playing a game involving throwing a ball into a bucket. Each child has 3 throws and the number of times the ball lands in the bucket, x, is recorded. Their results are given in the table (a) Find x(1) Sandra decides to model the game by assuming that on each throw, the probability of the ball landing in the bucket is for every child on every throw and that the throws are all independent. The random variable S represents the number of times the ball lands in the bucket for a randomly selected child. (b) Find P(S = 2)(2) (c) Complete the table below to show the probability distribution for (S = s) (1) Ting believes that the probability of the ball landing in the bucket is not the same for each throw.
9 He suggests that the probability will increase with each throw and uses the model pi = + where i = 1, 2, 3 and pi is the probability that the ith throw of the ball, by any particular child, will land in the bucket. The random variable T represents the number of times the ball lands in the bucket for a randomly selected child using Ting s model. (d) Show that (i) P(T = 3) = (ii) P(T = 1) = (5) (e) Complete the table below to show the probability distribution for T, stating the exact probabilities in each (T = t) (3) (f) State, giving your reasons, whether Sandra s model or Ting s model is the more appropriate for modelling this game.(3)Leave blank13 Turn over*P54879A01320* DO NOT WRITE IN THIS AREA DO NOT WRITE IN THIS AREA DO NOT WRITE IN THIS AREA DO NOT WRITE IN THIS AREA DO NOT WRITE IN THIS AREA DO NOT WRITE IN THIS AREAQ uestion 5 continued_____ DO NOT WRITE IN THIS AREA DO NOT WRITE IN THIS AREA DO NOT WRITE IN THIS AREAL eave blank14*P54879A01420* DO NOT WRITE IN THIS AREA DO NOT WRITE IN THIS AREA DO NOT WRITE IN THIS AREAQ uestion 5 continued_____Leave blank15 Turn over*P54879A01520* DO NOT WRITE IN THIS AREA DO NOT WRITE IN THIS AREA DO NOT WRITE IN THIS AREA DO NOT WRITE IN THIS AREA DO NOT WRITE IN THIS AREA DO NOT WRITE IN THIS AREAQ uestion 5 continued_____Q5(Total 15 marks)
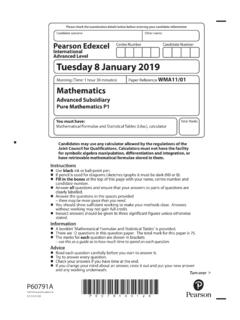
10 DO NOT WRITE IN THIS AREA DO NOT WRITE IN THIS AREA DO NOT WRITE IN THIS AREAL eave blank16*P54879A01620* DO NOT WRITE IN THIS AREA DO NOT WRITE IN THIS AREA DO NOT WRITE IN THIS AREA6. Following some school examinations, Chetna is studying the results of the 16 students in her class. The mark for paper 1, x, and the mark for paper 2, y, for each student are summarised in the following = y = x = y = xy = 15 837 (a) Comment on the differences between the marks of the students on paper 1 and paper 2(2) Chetna decides to examine these data in more detail and plots the marks for each of the 16 students on the scatter diagram opposite. (b) (i) Explain why the circled point (38, 0) is possibly an outlier. (ii) Suggest a possible reason for this result.