Transcription of Pearson Edexcel Cenre uer Cnte uer Level 3 GCE Monday 19 ...
1 Please check the examination details below before entering your candidate information Candidate surname Other names Centre Number Candidate Number Pearson Edexcel Level 3 GCE. Monday 19 October 2020. Afternoon Paper Reference 9MA0/31. Mathematics Advanced Paper 31: Statistics You must have: Total Marks Mathematical Formulae and Statistical Tables (Green), calculator Candidates may use any calculator allowed by Pearson regulations. Calculators must not have the facility for symbolic algebra manipulation, differentiation and integration, or have retrievable mathematical formulae stored in them. Instructions Use black ink or ball point pen. Fill If pencil is used for diagrams/sketches/graphs it must be dark (HB or B). in the boxes at the top of this page with your name, clearly centre number and candidate number. Answer all questions and ensure that your answers to parts of questions are there may labelled.
2 Answer the questions in the spaces provided be more space than you need. Answers without working You should show sufficient working to make your methods clear. Values may not gain full credit. from statistical tables should be quoted in full. If a calculator is used instead Inexact answers should be given to three significant figures unless otherwise stated. of tables the value should be given to an equivalent degree of accuracy. Information AThebooklet Mathematical Formulae and Statistical Tables' is provided. The total mark for this part of the examination is 50. There are 5 questions. marks for each question are shown in brackets use this as a guide as to how much time to spend on each question. Advice Read each question carefully before you start to answer it. Check your answers if you have time at the end. Try to answer every question. Turn over *P66788A0120*.
3 P66788A. 2020 Pearson Education Ltd. 1/1/1/1/1/. 1. The Venn diagram shows the probabilities associated with four events, A, B, C and D. B. A C. p D. q r s (a) Write down any pair of mutually exclusive events from A, B, C and D. (1). Given that P(B) = (b) find the value of p (1). Given also that A and B are independent (c) find the value of q (2). Given further that P ( B | C ) = (d) find (i) the value of r (ii) the value of s (4). _____. _____. _____. _____. _____. _____. _____. _____. _____. _____. _____. _____. _____. 2. *P66788A0220*. Question 1 continued _____. _____. _____. _____. _____. _____. _____. _____. _____. _____. _____. _____. _____. _____. _____. _____. _____. _____. _____. _____. _____. _____. _____. _____. _____. _____. _____. _____. _____. _____. _____. _____. _____. _____. (Total for Question 1 is 8 marks). 3. *P66788A0320* Turn over 2. A random sample of 15 days is taken from the large data set for Perth in June and July 1987.
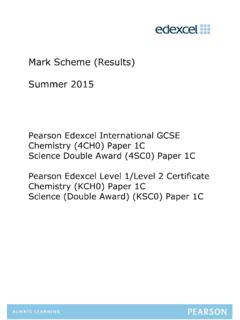
4 The scatter diagram in Figure 1 displays the values of two of the variables for these 15 days. y 0 x 0 10 15 20. Figure 1. (a) Describe the correlation. (1). The variable on the x-axis is Daily Mean Temperature measured in C. (b) Using your knowledge of the large data set, (i) suggest which variable is on the y-axis, (ii) state the units that are used in the large data set for this variable. (2). Stav believes that there is a correlation between Daily Total Sunshine and Daily Maximum Relative Humidity at Heathrow. He calculates the product moment correlation coefficient between these two variables for a random sample of 30 days and obtains r = (c) Carry out a suitable test to investigate Stav's belief at a 5% Level of significance. State clearly your hypotheses your critical value (3). On a random day at Heathrow the Daily Maximum Relative Humidity was 97%. (d) Comment on the number of hours of sunshine you would expect on that day, giving a reason for your answer.
5 (1). 4. *P66788A0420*. Question 2 continued _____. _____. _____. _____. _____. _____. _____. _____. _____. _____. _____. _____. _____. _____. _____. _____. _____. _____. _____. _____. _____. _____. _____. _____. _____. _____. _____. _____. _____. _____. _____. _____. _____. _____. _____. 5. *P66788A0520* Turn over Question 2 continued _____. _____. _____. _____. _____. _____. _____. _____. _____. _____. _____. _____. _____. _____. _____. _____. _____. _____. _____. _____. _____. _____. _____. _____. _____. _____. _____. _____. _____. _____. _____. _____. _____. _____. _____. 6. *P66788A0620*. Question 2 continued _____. _____. _____. _____. _____. _____. _____. _____. _____. _____. _____. _____. _____. _____. _____. _____. _____. _____. _____. _____. _____. _____. _____. _____. _____. _____. _____. _____. _____. _____. _____. _____. _____. _____. (Total for Question 2 is 7 marks).
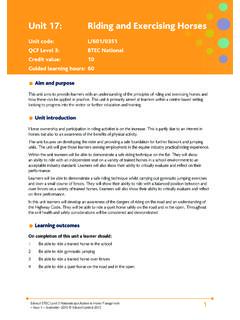
6 7. *P66788A0720* Turn over 3. Each member of a group of 27 people was timed when completing a puzzle. The time taken, x minutes, for each member of the group was recorded. These times are summarised in the following box and whisker plot. 0 10 20 30 40 50 60 70. Time (x minutes). (a) Find the range of the times. (1). (b) Find the interquartile range of the times. (1). For these 27 people x = and x 2. = 17 (c) calculate the mean time taken to complete the puzzle, (1). (d) calculate the standard deviation of the times taken to complete the puzzle. (2). Taruni defines an outlier as a value more than 3 standard deviations above the mean. (e) State how many outliers Taruni would say there are in these data, giving a reason for your answer. (1). Adam and Beth also completed the puzzle in a minutes and b minutes respectively, where a > b. When their times are included with the data of the other 27 people the median time increases the mean time does not change (f) Suggest a possible value for a and a possible value for b, explaining how your values satisfy the above conditions.
7 (3). (g) Without carrying out any further calculations, explain why the standard deviation of all 29 times will be lower than your answer to part (d). (1). _____. _____. _____. _____. _____. 8. *P66788A0820*. Question 3 continued _____. _____. _____. _____. _____. _____. _____. _____. _____. _____. _____. _____. _____. _____. _____. _____. _____. _____. _____. _____. _____. _____. _____. _____. _____. _____. _____. _____. _____. _____. _____. _____. _____. _____. _____. 9. *P66788A0920* Turn over Question 3 continued _____. _____. _____. _____. _____. _____. _____. _____. _____. _____. _____. _____. _____. _____. _____. _____. _____. _____. _____. _____. _____. _____. _____. _____. _____. _____. _____. _____. _____. _____. _____. _____. _____. _____. _____. 10. *P66788A01020*. Question 3 continued _____. _____. _____. _____. _____. _____. _____. _____. _____. _____.
8 _____. _____. _____. _____. _____. _____. _____. _____. _____. _____. _____. _____. _____. _____. _____. _____. _____. _____. _____. _____. _____. _____. _____. _____. (Total for Question 3 is 10 marks). 11. *P66788A01120* Turn over 4. The discrete random variable D has the following probability distribution d 10 20 30 40 50. k k k k k P (D = d ). 10 20 30 40 50. where k is a constant. 600. (a) Show that the value of k is 137. (2). The random variables D1 and D2 are independent and each have the same distribution as D. (b) Find P (D1 + D2 = 80). Give your answer to 3 significant figures. (3). A single observation of D is made. The value obtained, d, is the common difference of an arithmetic sequence. The first 4 terms of this arithmetic sequence are the angles, measured in degrees, of quadrilateral Q. (c) Find the exact probability that the smallest angle of Q is more than 50.
9 (5). _____. _____. _____. _____. _____. _____. _____. _____. _____. _____. _____. _____. _____. _____. _____. _____. _____. 12. *P66788A01220*. Question 4 continued _____. _____. _____. _____. _____. _____. _____. _____. _____. _____. _____. _____. _____. _____. _____. _____. _____. _____. _____. _____. _____. _____. _____. _____. _____. _____. _____. _____. _____. _____. _____. _____. _____. _____. _____. 13. *P66788A01320* Turn over Question 4 continued _____. _____. _____. _____. _____. _____. _____. _____. _____. _____. _____. _____. _____. _____. _____. _____. _____. _____. _____. _____. _____. _____. _____. _____. _____. _____. _____. _____. _____. _____. _____. _____. _____. _____. _____. 14. *P66788A01420*. Question 4 continued _____. _____. _____. _____. _____. _____. _____. _____. _____. _____. _____. _____. _____. _____. _____. _____. _____. _____. _____.
10 _____. _____. _____. _____. _____. _____. _____. _____. _____. _____. _____. _____. _____. _____. _____. (Total for Question 4 is 10 marks). 15. *P66788A01520* Turn over 5. A health centre claims that the time a doctor spends with a patient can be modelled by a normal distribution with a mean of 10 minutes and a standard deviation of 4 minutes. (a) Using this model, find the probability that the time spent with a randomly selected patient is more than 15 minutes. (1). Some patients complain that the mean time the doctor spends with a patient is more than 10 minutes. The receptionist takes a random sample of 20 patients and finds that the mean time the doctor spends with a patient is minutes. (b) Stating your hypotheses clearly and using a 5% significance Level , test whether or not there is evidence to support the patients' complaint. (4). The health centre also claims that the time a dentist spends with a patient during a routine appointment, T minutes, can be modelled by the normal distribution where T ~ N(5, ).