Transcription of Pearson Edexcel Level 3 GCE Economics A
1 Centre NumberCandidate NumberWrite your name hereSurnameOther namesTotal MarksPaper ReferenceTurn over *P49595A0128*P49595A 2016 Pearson Education Use black ink or ball-point pen. Fill in the boxes at the top of this page with your name, centre number and candidate number. Answer all questions in Section A. In Section B, answer all of questions 6(a) to 6(e) and one question from 6(f) or 6(g). Answer the questions in the spaces provided there may be more space than you The total mark for this paper is 80. The marks for each question are shown in brackets use this as a guide as to how much time to spend on each question. Calculators may be Read each question carefully before you start to answer it. Check your answers if you have time at the do not need any other 23 May 2016 MorningTime: 1 hour 30 minutesEconomics AAdvanced SubsidiaryPaper 2: The UK economy performance and policiesPearson Edexcel Level 3 GCE*P49595A0228*2 SECTION AAnswer ALL questions.
2 Write your answers in the spaces questions must be answered with a cross in the box . If you change your mind about an answer, put a line through the box and then mark your new answer with a cross .You are advised to spend 25 minutes on this the data to support your answers where relevant. You may annotate and include diagrams in your (a) Define the term national income .(1).. (b) Which one of the following is an injection into the circular flow of income?(1)A Tax at i o nB ImportsC InvestmentD Saving (c) Define the term circular flow of income .(2)..(Total for Question 1 = 4 marks)*P49595A0328*Turn over 3 2 The table below shows GDP per capita at purchasing power parities (PPPs) for a selection of European countries in per capita (US$, at PPPs, 2013, rounded)UK38 500 Spain33 000 Italy35 500(Source: ) (a) Define the term purchasing power parities.
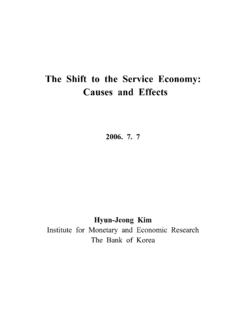
3 (2).. (b) The Office for National Statistics estimates that the UK population was 64 million in 2013. Using the data, what was the UK s total GDP in 2013? (1)A $2 464 000 millionB $2 272 000 millionC $1 662 000 millionD $2 112 000 million*P49595A0428*4 (c) Diagram A shows the aggregate demand and aggregate supply for a country. Illustrate actual economic growth on Diagram A. (1)Diagram AAggregate supplyPricelevelP1 Aggregate demandReal outputY1(Total for Question 2 = 4 marks)*P49595A0528*Turn over 5 3 The table below shows claimant count data for the of ClaimantsAugust 2014961 149 September 2014923 240 October 2014887 771 November 2014848 085 December 2014823 880 January 2015852 934 February 2015858 344(Source: ) (a) Define the term claimant count .(1).. (b) Calculate the percentage change in the claimant count from August 2014 to February 2015.
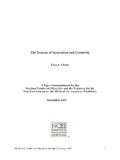
4 (2).. (c) Which one of the following is likely to cause a reduction in the claimant count?(1)A An increase in the weekly payment for claimantsB A compulsory weekly interview for every claimantC An increase in the size of the workforceD A fall in employment(Total for Question 3 = 4 marks)*P49595A0628*6 4 Figure 1 shows data on the UK s balance of 1 UK s balance of trade January 2013 to January 201510 Balance of Trade in Goods billion, seasonally adjustedBalance of Trade in ServicesBalance of Total UK Trade86420-2-4-6-8-10-122015 Jan2014 Dec2014 Nov2014 Oct2014 Sep2014 Aug2014 Jul2014 Jun2014 May2014 Apr2014 Mar2014 Feb2014 Jan2013 Dec2013 Nov2013 Oct2013 Sep2013 Aug2013 Jul2013 Jun2013 May2013 Apr2013 Mar2013 Feb2013 Jan(Source: ) (a) Which one of the following can be inferred from Figure 1 in the period shown?
5 (1)A The total UK trade deficit was the largest in June 2013B The trade in goods was always in surplus between January 2013 and January 2015C The total UK trade deficit was the smallest in January 2014D The trade in goods deficit was the smallest in June 2013*P49595A0728*Turn over 7 (b) Explain one likely reason for the reduction in the total UK trade deficit in January 2015.(3)..(Total for Question 4 = 4 marks)*P49595A0828*8 5 In 2014 the Bank of England estimated the marginal propensity to consume of UK consumers to be In 2014 the Chancellor of the Exchequer announced a 15 billion investment programme into UK road infrastructure.(Sources: 2014 and autumn-statement-2014-16-things-you-shou ld-know) (a) Using the information above, calculate the total increase in national income, resulting from the 15 billion investment.
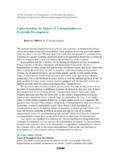
6 (3).. (b) Which one of the following is most likely to cause a rightward shift in the aggregate supply curve?(1)A A decrease in real outputB A rise in price levelC A fall in price levelD An increase in productivity(Total for Question 5 = 4 marks)TOTAL FOR SECTION A = 20 MARKS*P49595A0928*Turn over 9 SECTION BRead Figures 1 and 2 below and read extracts A and B before answering Question ALL Question 6 (a) to 6 (e) and EITHER Question 6 (f ) OR Question 6 (g).You are advised to spend 1 hour and 5 minutes on this section. Question 6UK incomes, inflation and monetary policyFigure 1 UK average weekly household real income5802006200720082009201020112012201 3600620640 660680700(Source: 2014- ) Figure 2 UK inflation rate as measured by percentage changes in the Consumer Price Index (CPI) 2011 Apr 2011 Jul 2011 Oct 2011 Jan 2012 Apr 2012 Jul 2012 Oct 2012 Jan 2013 Apr 2013 Jul 2013 Oct 2013 Jan 2014 Apr 2014 Jul 2014 Oct 2014(Source: )*P49595A01028*10 Extract ABritons should not fear rise in interest ratesThe Monetary Policy Committee (MPC) of the Bank of England is prepared to raise interest rates in the near future if inflation increases, one of its senior policymakers has warned.
7 Kristin Forbes, a member of the MPC, said a rise in borrowing costs would also be necessary should household debt reach unhealthy levels. However, she stressed that this was not yet a cause for the UK s base rate of interest at and inflation at a record low and expected to be negative, the MPC is currently under no pressure to raise interest rates, despite Britain s economic recovery. UK inflation is being driven lower by the slump in global oil prices, which have roughly halved since summer 2014, and the Bank s governor Mark Carney warned earlier this month that a strong domestic economy would translate into higher UK inflation over the medium term. The most likely next move in monetary policy is an increase in interest rates. The message is clear, Carney said. Forbes said that even the more lagged effects of the rise in the value of the pound will likely peak in the first part of this year and also gradually fade.
8 Inflation will then most likely bounce back. Since interest rates take well over a year to be fully effective, they should be adjusted to respond to inflationary risks at that time horizon when all of these effects have diminished rather than respond to today s inflation. (Source: adapted from britons-should-not-fear-rise-in-interest -rates- when-they-come-says-boe-member)Extract BDeflation is bad newsThe problem with deflation is that once you have it you can t get rid of it. Central banks know what to do about inflation but they do not have the policy tools to deal with deflation when interest rates are almost as low as they can go. Just look at Japan, which had deflation in nine separate years from 1999-2012, with two additional years at zero, averaging minus The highest in any single year was minus in 2013.
9 In the European Union (EU) in 2008, at the start of the financial crisis, there were fears of deflation but at that time central banks had the ability to cut interest rates by nearly 5 percentage points. Those fears may now be coming true, with the EU experiencing deflation of in 2015. This was driven primarily by declines in energy prices, but there was also deflation in non-energy industrial goods and telecommunications. The collapse in the cost of shipping goods potentially suggests something deeper is going on and may lead to a more persistent form of deflation than Mark Carney has currently claimed.(Source: adapted from )51051015*P49595A01128*Turn over 11 6 (a) With reference to Figure 1, explain the term real income . (4) (b) Assess the likely impact of falling real incomes on UK consumers.
10 (10) (c) With reference to Extract A, explain the likely effect of a rise in the value of the pound on aggregate demand. (5) (d) With reference to the data, explain two likely reasons for the UK s falling inflation rate. (6) (e) With reference to Extracts A and B and your own knowledge , discuss whether the MPC should be concerned about the risk of deflation in the UK economy . (15)Answer EITHER (f ) Evaluate whether the MPC has been successful in controlling the UK s inflation rate since 2011. (20)OR (g) Evaluate demand-side policy responses to the Global Financial Crisis of 2008. (20)*P49595A01228*12 6 (a) With reference to Figure 1, explain the term real income.