Transcription of Pedestrian Safety Action Plan 2014-2016
1 Pedestrian Safety Action plan 2014 2016 May 2014 CONTENTS1. INTRODUCTION 22. Pedestrian ROAD TRAUMA AGE RELATED Pedestrian ROAD TRAUMA ROAD ENVIRONMENT AND LOCATION ALCOHOL INVOLVEMENT TIME OF DAY SERIOUS INJURIES 43. COUNTERMEASURES SAFER SPEEDS SAFER ROADS SAFER VEHICLES ROAD Safety TECHNOLOGY SAFER PEOPLE 84. Action plan 2014-2016 105. SUMMARY 141 Pedestrian Safety Action plan 2014 20161. INTRODUCTIONTHE GOVERNMENT IS STRONGLY COMMITTED TO IMPROVING ROAD Safety FOR THE NSW COMMUNITY. THE 2013 PROVISIONAL NSW ROAD TOLL WAS 339 FATALITIES, 30 LESS THAN 2012, AND THE LOWEST ANNUAL ROAD TOLL SINCE NSW Road Safety Strategy for 2012-21 aims to reduce road trauma in NSW over the next decade.
2 It sets out the strategic direction the NSW Government is taking to address this important issue, and aims to reduce fatalities and serious injuries by at least 30 per achieve the NSW Road Safety Strategy objectives, Transport for NSW identified the need for the development of a specific Action plan to address Pedestrian are vulnerable road users and in the event of a crash, unlike vehicle occupants, have little or no protection to shield them from the force of a crash. Therefore, Pedestrian related crashes often result in more severe for NSW s Centre for Road Safety is the lead agency for road Safety in NSW and in consultation with stakeholders has developed a range of countermeasures to address Pedestrian Safety .
3 Road Safety experts and stakeholders included: NSW Police Force Local Government NSW Motor Accidents Authority Department of Education and Communities Department of Family and Community Services Pedestrian Council of Australia NRMA Motoring and Services Insurance Australia Group The George Institute for Global Health Transport and Road Safety Research, UNSW City of Sydney Council Monash University Accident Research CentreThis Action plan has been developed collectively based on the feedback received from stakeholders. The Centre for Road Safety will continue coordinating road Safety initiatives across Government, and work with stakeholders to implement the actions contained within this Hon.
4 Duncan Gay MLC Minister for Roads and Freight2 Transport for NSW2. Pedestrian ROAD TRAUMAIn 1960 there was a peak of 367 Pedestrian fatalities, which accounted for more than one third of all road fatalities in NSW. Since this time, Pedestrian fatalities have decreased 2011, there were 49 Pedestrian fatalities on NSW roads, accounting for 13 per cent of the road toll. 55 pedestrians were killed in 2012 and 42 in these recent numbers are at record low levels, the NSW Government recognises that over the coming decade there is more work to do in the implementation of the NSW Road Safety Strategy. There are various factors which may contribute to Pedestrian crashes across the network.
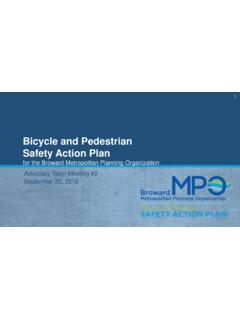
5 This includes a growing population, ageing population and walking becoming a more popular mode of Safety crash data analysis undertaken from 2007 to 2011 has informed a range of countermeasures detailed in this Action plan , some of the data highlights are provided AGE RELATED Pedestrian ROAD TRAUMAY oung pedestrians aged between 17 to 29 are over represented in road trauma, making up 22 per cent of fatalities and 26 per cent of injuries and yet only 18 per cent of the NSW population. The elderly, aged 70 years or more represent only 10 per cent of the population, yet account for 30 per cent of all Pedestrian fatalities.
6 Given the projected ageing population, this represents a growing , males are over represented in fatalities and injuries accounting for 73 per cent of Pedestrian fatalities between 2007 and Casualties, 2007 to 2011, Degree of Casualty, Age Group010203040 Killed0 166%22%21%21%30%19%26%22%16%11%22%18%28% 22%10%PercentageInjuredDegree of CasualtyEstimated ResidentPopulation (2009)17 2930 4950 6970+ ROAD ENVIRONMENT AND LOCATIONS peed LimitsSpeed limits play a critical role in Pedestrian Safety . It has been well researched and demonstrated that increased vehicle speeds bring an increased crash risk to not only vehicle occupants, but also , speed limits are zoned at 50km/h or lower in high Pedestrian activity areas.
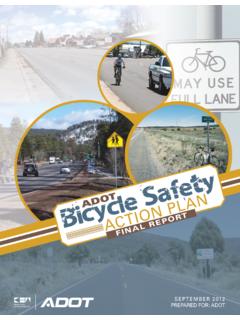
7 Higher travel speed leads to sharp increases in injury risk to pedestrians, which poses particular concerns to an aging NSW, the majority of Pedestrian fatalities occur on roads with a posted speed limit of 60km/h or more. Whereas, nearly two-thirds of all injuries occur on roads with a posted speed limit of 50km/h or TypeMid-block locations with no traffic signals or Pedestrian controls account for the majority of fatalities and almost 40 per cent of injuries. The largest proportion of casualties also occur on local roads and within metropolitan Safety Action plan 2014 2016 Pedestrian Casualties, 2007 to 2011, Degree of Casualty.
8 Location Types x Traffic signals/ Pedestrian Controls 020406080 Killed7%10%0%18%61%2%1%1%15%10%4%23%39%4 %2%4%PercentageDegree of CasualtyInjuredIntersection tra c signals onlyIntersection tra c signals with ped crossingIntersection unsignalised ped crossingIntersection no signals / ped crossingMid block tra c signals onlyMid block tra c signals with ped crossingMid block unsignalised ped crossingMid block no signals / ped ALCOHOL INVOLVEMENTA lcohol involvement in Pedestrian casualties (with a Pedestrian s blood alcohol content (BAC) of or more) aged between 17 to 49 accounts for at least half of all Pedestrian fatalities and 12 per cent of TIME OF DAYP edestrian fatalities are more prevalent during autumn and winter months.
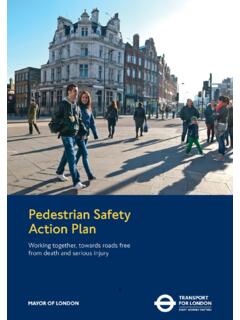
9 Data also suggests during these times that a higher proportion of fatalities occur during darkness. Shorter days with peak Pedestrian activity in reduced lighting conditions may be contributing to this SERIOUS INJURIEST ransport for NSW commissioned the Transport and Road Safety (TARS) Research Group at the University of NSW to investigate links between the NSW crash data, Hospital and Registry of Births, Deaths and Marriages datasets. The aim was to identify and analyse serious injuries to support delivery of the NSW Road Safety linkage found between 2001-2011, 68,383 serious injures, representing around one quarter of all injuries.
10 Of this, 13 per cent of all serious injuries involved a vehicle impact with a most common types of injuries sustained by pedestrians were injuries to head, to knee and lower leg and injuries to the abdomen, lower back, lumbar spine and research also analysed the length of hospitalised stay, with pedestrians experiencing the longest average stay of days. The study found that people aged 80 years or more, spent on average twice as long in hospital compared to those aged under Serious Injuries, Proportion of Injury Diagnoses, NSW, 2001 to 2011 Injuries to headInjuries to elbowand forearmInjuries to wristand handInjuries to ankleand footInjuries to hipand thighInjuries to kneeand lower legInjuries to neckInjuries to thoraxInjuries to shoulderand upper armInjuries to abdomen,lower back, lumbar,spine and pelvis0%10%20%30%40%50%60%SUMMARY OF THE MAIN ISSUES FOR Pedestrian CASUALTIES.